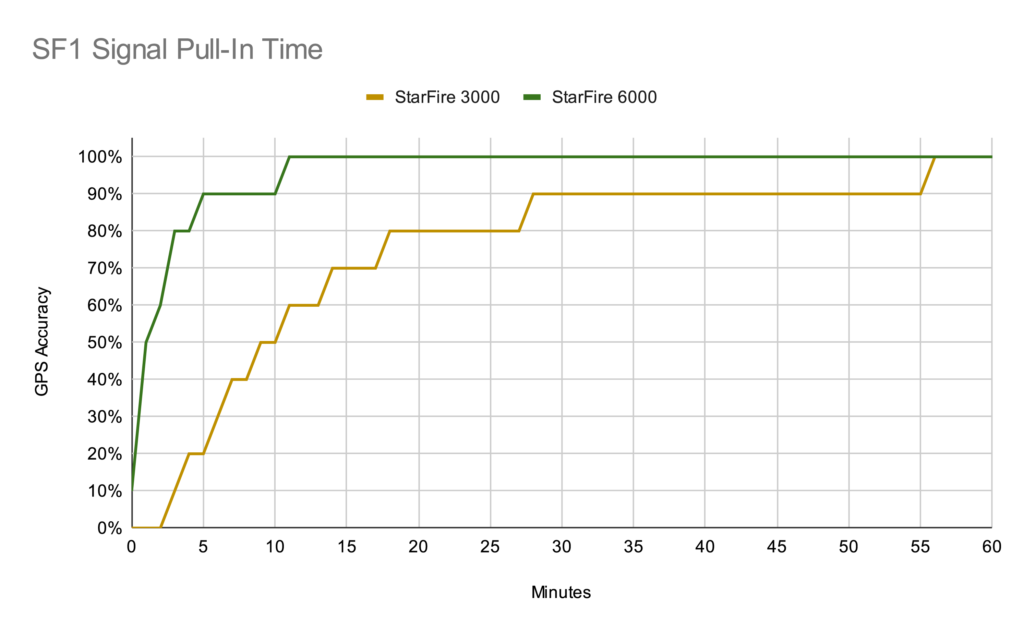
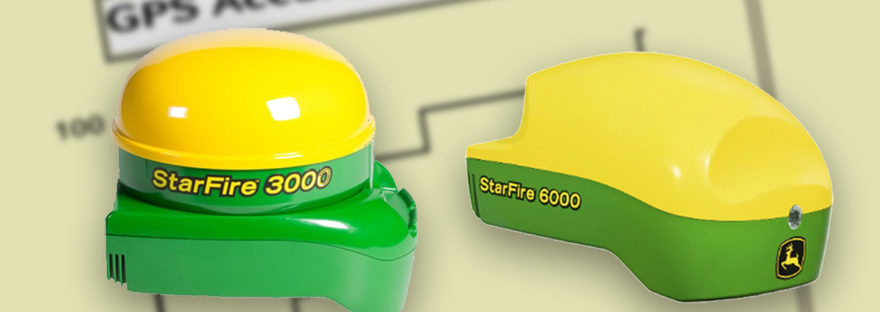
StarFire 3000 globes currently sell for $one arm and a leg, while 6000s sell for $one arm and two legs. If you’re shopping between the two and don’t need SF3, one of the most important improvements of the 6000 is the faster pull-in time. We have one of each on our farm and the repetitive days of fall tillage allowed me to do some real-world comparisons between each.
Data Collection
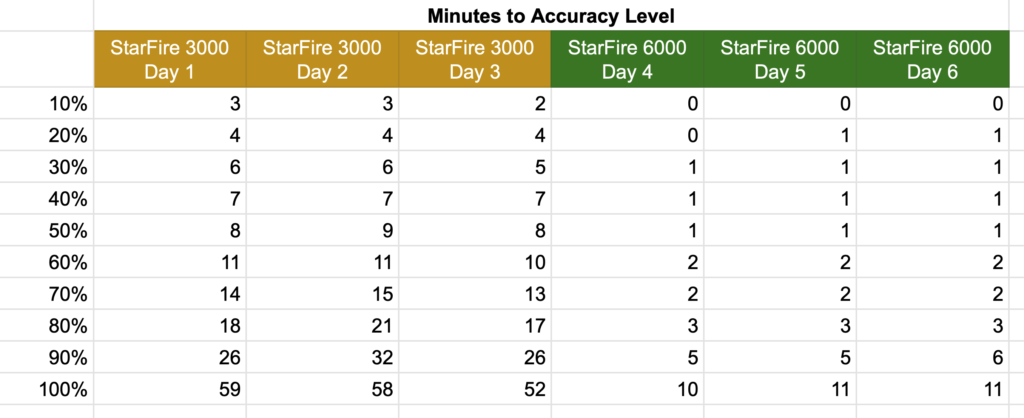
I collected this data across 6 days in early November (3 days with each globe) in mostly clear skies and flat open fields. Each morning I would keep an eye on the GPS accuracy graph in the StarFire > Diagnostics > Data Logs page, then take a screenshot once it reached 100%.
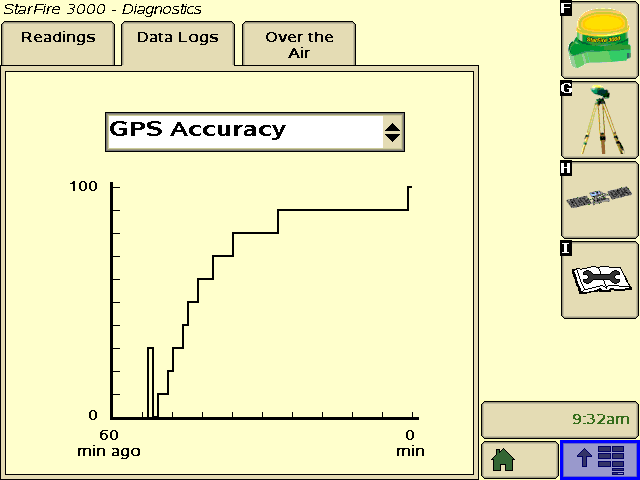
In each case, the tractor had been operated the day before and was put in a shed overnight. Both are using SF1 and running on a 2600 display.
Data Extraction
These screens are 640 x 480 pixels, and as it turns out the x-axis of this data log graph is 300 pixels wide. I ran these through a batch process in Photoshop to add y-axis labels at the 10% marks and to adjust the pixel density to 1 pixel per inch. Then I set the zero point of the ruler to the time the receiver turned on. Once this is done, I can drag a guide to a step on the graph and the tooltip will tell me how many inches (pixels) that is from the start point. Record these values in a spreadsheet, divide my 5 (pixels per minute), and you have data that should be accurate to about a minute after adjusting for the thickness of the line.
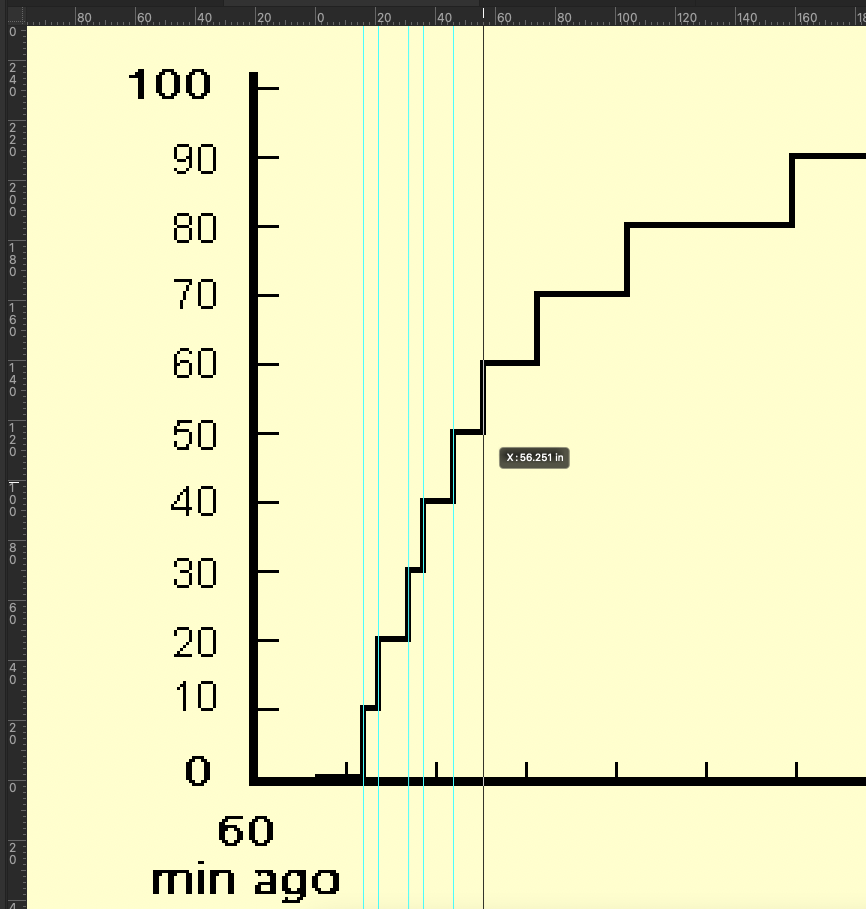
This is the part where someone will probably ruin my Photoshop fun and tell me there’s a way to export this data to a CSV in some kind of diagnostics function.
Results
Raw Data
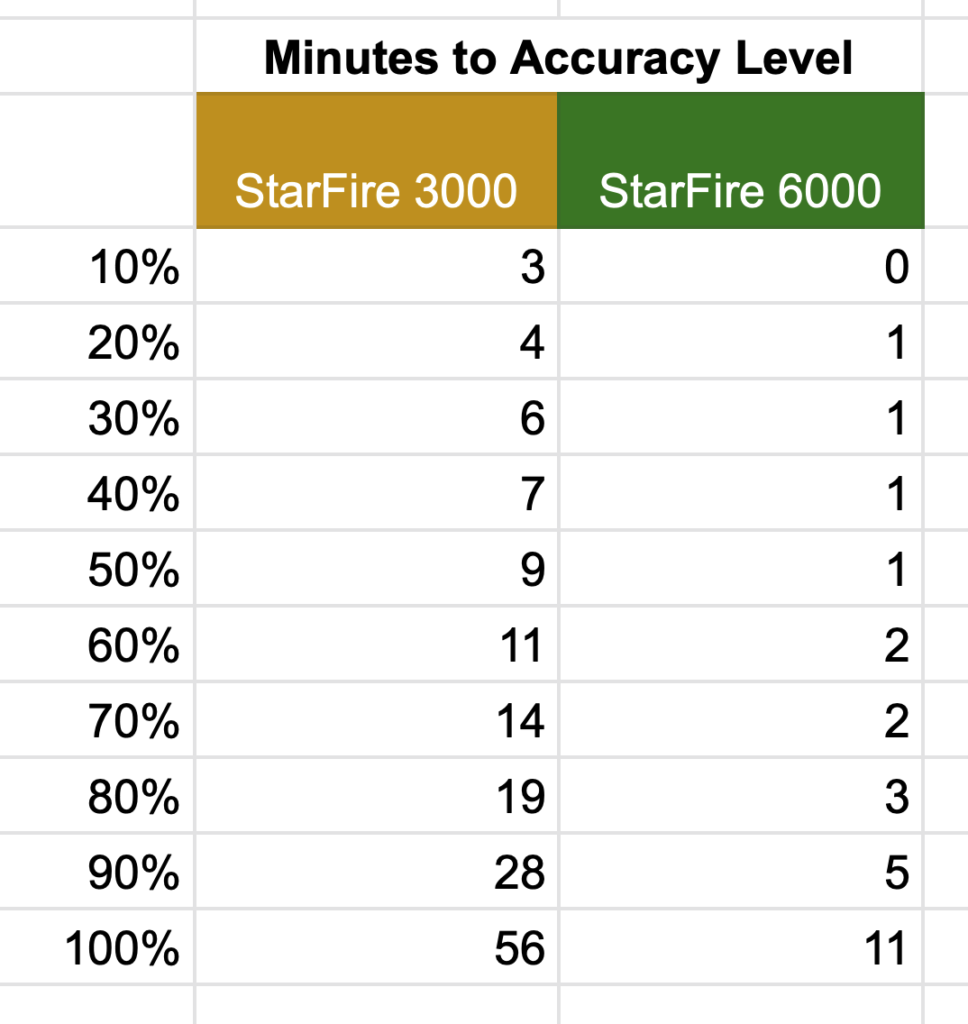
Averaged by Model
Graph
