On May 17th 2022, the FAA shut down WAAS correction satellite 138, replacing it with WAAS satellite 135. If you’re seeing “Low Accuracy No Corrections” since this change, you’ll need to adjust your corrections.
Instructions
Navigate to Config menu > GPS > Corrections > Edit
You can get to the Config menu by scrolling all the way down on the icons along the right side of the run screen. It’s a wrench icon.
Select Edit WAAS
Set the satellites to the following values
PRN-122: Off
POR: Off
PRN-135: On
PRN-138: Off
This should be all you need to do. Navigate back to the run screen and see if the Low Accuracy No Correction message goes away (this could take a few minutes).
Superstition
In theory, making the adjustment above should fix it. If it does not, consider returning to the the Corrections Edit page and setting the other correction types to the following values. I don’t know what all of these do, but I know that ours works with them set to these values.
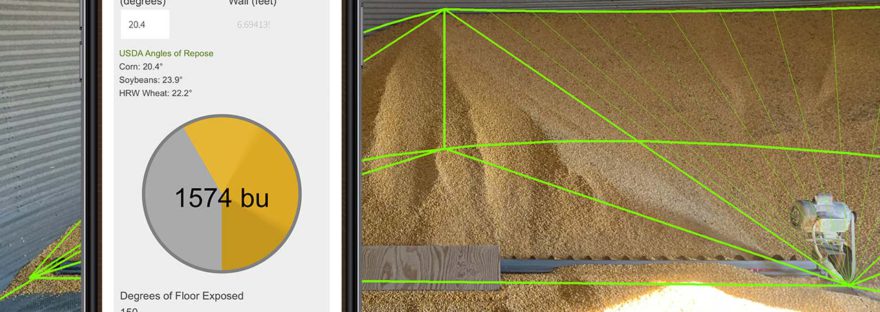
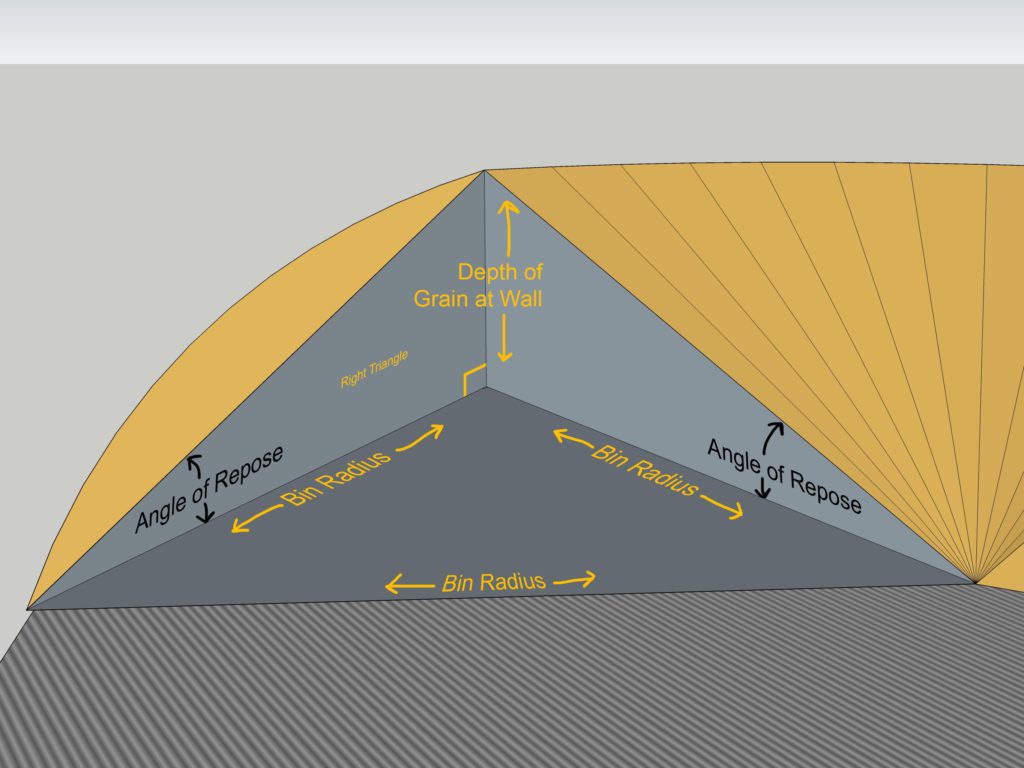
These calculations require 3 inputs as you see above
Diameter of Bin
Angle of Repose OR Depth of Grain at the wall (both are needed eventually, so inputing one will calculate the other)
Degrees of floor exposed
Initial Geometry
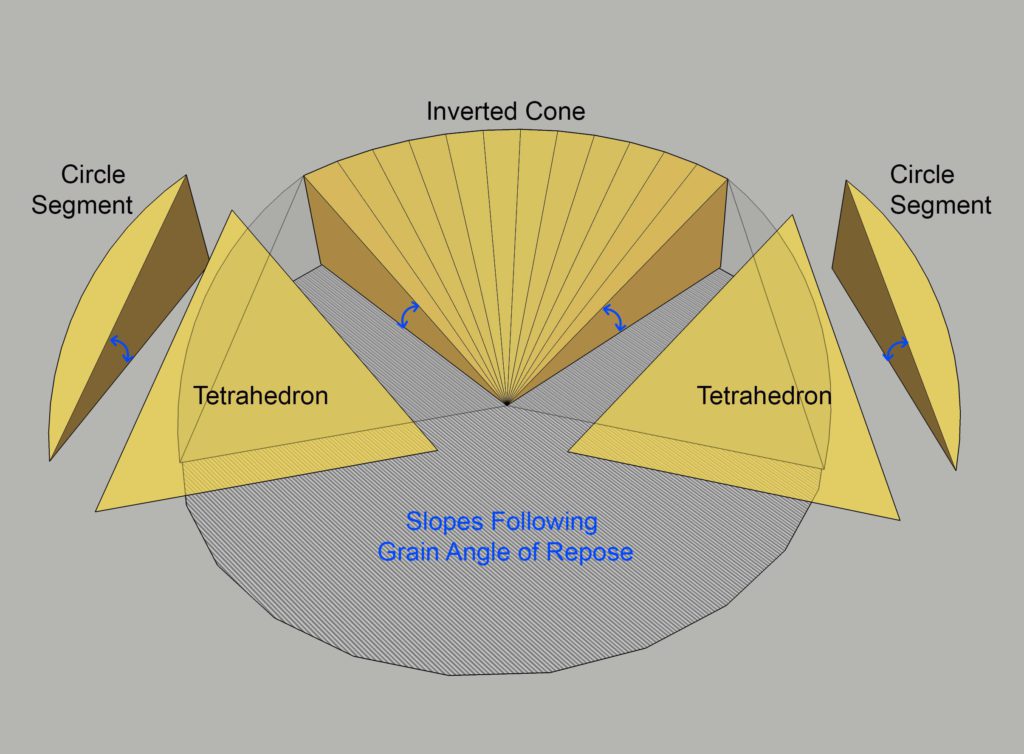
During the initial stage of emptying a bin with a sweep auger, the pile of grain can be approximated in 3 geometric shapes
(Part of) An inverted cone
Two tetrahedrons
Two circle segments (cut diagonally in half) to fill in the curved wall shape behind the tetrahedrons
Inverted Cone
The inverted cone is simple to calculate. First, calculate the volume of a cylinder the diameter of the bin and as tall as the height of the grain at the wall. Then, calculate the volume of a cone with the same footprint and height and subtract that cone of air from the cylinder of grain. Since the volume of a cone which you're subtracting is 1/3 the base surface area times the height, a shortcut for an inverted cone is to just take 2/3 of the volume of the starting cylinder.
The volume for the entire inverted cone would represent a bin which has quit running out of the center sump and has never had a side sump open. We'll need to only use a percent of this based on how many degrees of the floor are exposed and how many are taken up by the tetrahedrons.
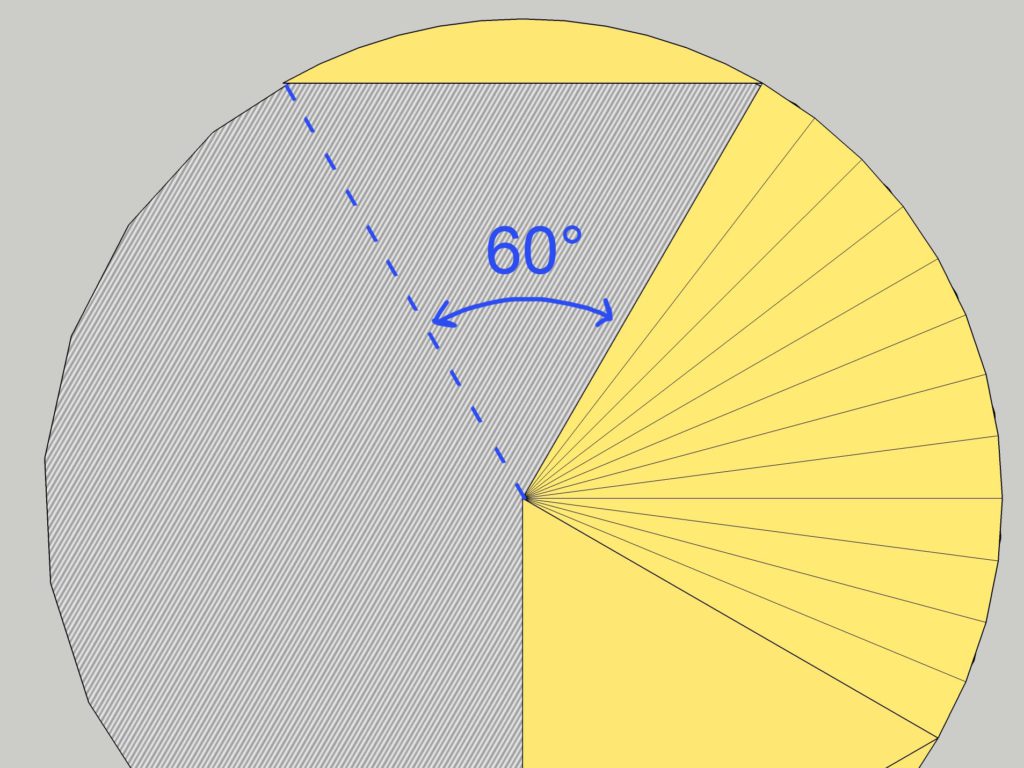
We already know that the two sides of the tetrahedron not facing the wall will have to be the radius of the bin. I also think it's reasonable to make the wall side the radius of the bin (and thus, an equilateral triangle base) because:
That's roughly what it looks like standing in front of it
This makes the angle of repose from the top point of the tetrahedron to the outside of the sweep equal to that from the top point to the center sump
This simplifies the calculations because the tetrahedron bases will always be 60°
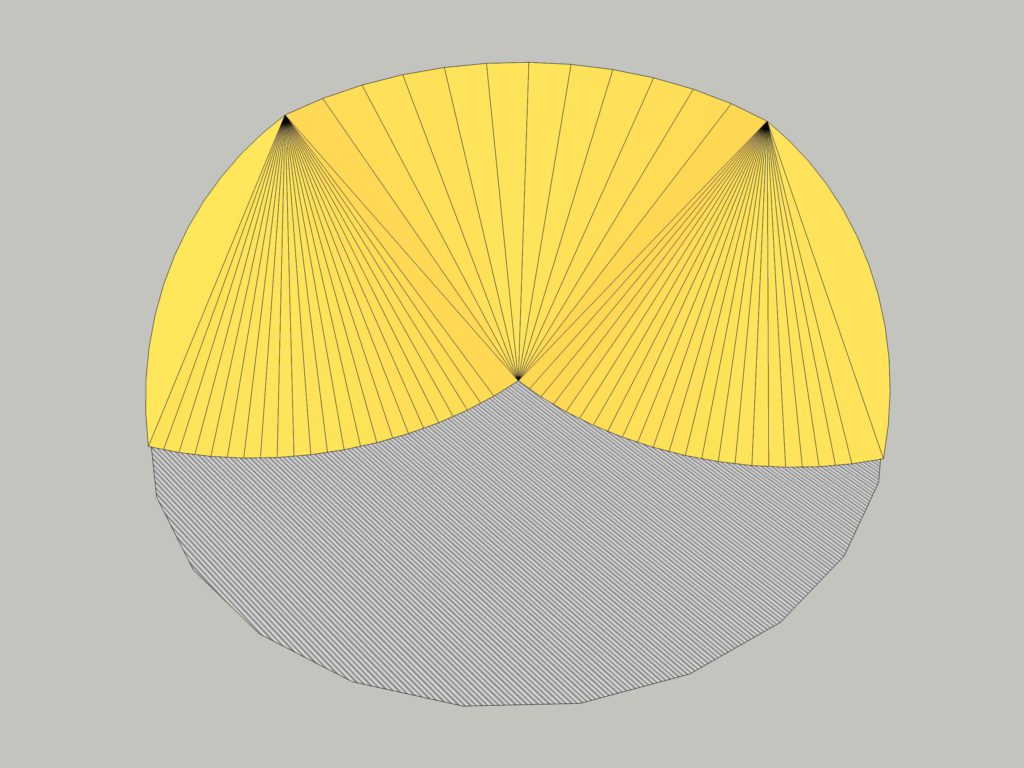
Figure 1: how grain flows in the movies
In a perfect world, the grain should fan out from the peak at its angle of repose as visualized above. But in practice, it's constrained by a flat sweep auger on one end and on the other end you may have side sumps that have created a flat edge by the time the sweep is started. Plus, you'll be running the sweep deeper into the center of the pile with less contact on the ends, so it's averaging somewhere in the middle. So I think the flat tetrahedrons with an equilateral base are a reasonable representation.
To calculate the volume of the tetrahedron, we can take the surface area of the base times 1/3 of the height. Heron's formula can be used to get the surface area of a triangle with 3 known sides.
Finally, we need to account for the sliver between the flat-backed tetrahedron and the curved bin wall. This is called a segment of a circle and is straightforward to calculate given that the angle will always be 60° for an equilateral triangle base.
Since it will always be 60° in this method, we can compute out all the angle stuff into one coefficient to multiply by binRadius^2.
0.181172147412159 * binRadius^2
Now that we have the surface area of the base, we can get the volume by multiplying it by the depth of the grain at the wall and dividing by 2. (I don't have a math expert on the internet telling me this is the formula for a diagonally cut extruded segment, but generally if you cut a shape in half along a symmetrical line, it's simply base * height / 2.)
Now simply add together the inverted cone and two of the identical tetrahedrons and circle segments, and you have total cubic footage. Then divide by 1.24446 cubic feet per bushel.
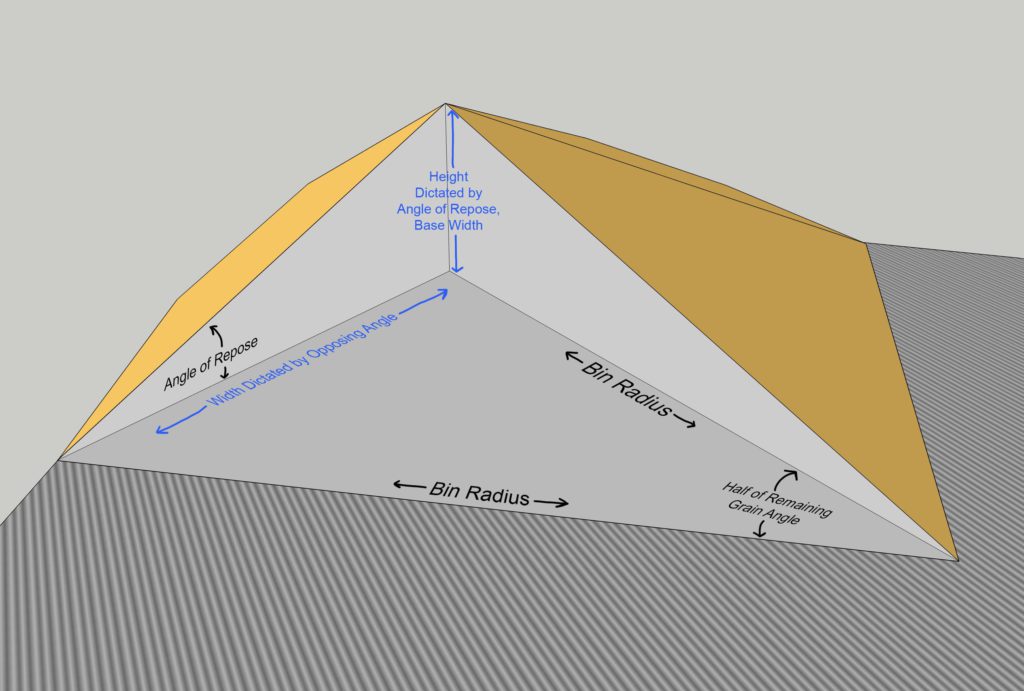
Ending Geometry
When finishing a bin, the original inverted cone eventually goes away and you start eating down a single symmetrical pile of two (shrinking) tetrahedrons and segments behind them. Given that we established the original tetrahedrons above at 60° each, this transition occurs when 240° of the floor is exposed (with 120° of grain remaining). From this point forward, the tetrahedrons get narrower (less than 60°) and the grain height at the wall gets shorter.
Tetrahedrons
Known values are in black, calculated values are in blue.
First we'll need to calculate the width of the side of the tetrahedron facing the wall. We know the two other sides (bin radius) and the angle connecting them (half of the remaining pile angle) so we can use the cosine rule to get the length opposing the angle.
Now that the width of the wall side is known, we can calculate the depth of the pile at the peak in conjunction with the angle of repose. This triangle on the wall side is a right triangle, so the sohcahtoa rules apply and the tangent function would be used.
With some rearranging of the equation, the formula would be:
Calculating the volume would work the same as before; use Heron's formula with two bin radii and the wall side length calculated a bit ago, then multiply by the pile peak depth and divide by 3.
Circle Segments
These work the same as earlier, except we can't take any 60° shortcuts.
The wall depth is known from above, so that would be multiplied by this footprint surface area and divided by two.
Put together two of these tetrahedrons and two circle segments, divide by 1.24446 cubic feet per bushel, and you're set.
Accuracy
SketchUp
I created the 3D models in SketchUp not only to help visualize the geometry, but because I can check the volume of each 3D polygon. I found and corrected two calculation errors through checking it this way.
Initial Geometry
This was with 150° of clean floor on a 36' bin with a 20.4° angle of repose- the same as shown in the models photos above. Numbers are in cubic feet.
SketchUp
Calculator
Inverted Cone
1,133
1,130
Tetrahedron
313
313
Circle Segment
104
98
Total
1,967 ft3
1,952 ft3
Note: the total is doubling the tetrahedron and segment volumes since there are two in the pile
In this case the calculator is showing 15 ft3 (12 bushels) less than the SketchUp model. This is within 1% and variance can be explained by SketchUp trying to make rounded shapes out of linear, blocky polygons.
Ending Geometry
This was with 270° of clean floor, still a 36' bin and a 20.4° angle of repose.
SketchUp
Calculator
Tetrahedron
196
196
Circle Segment
30
32
Total
452 ft3
456 ft3
This time the calculator shows 4 ft3 (3 bushels) more than the SketchUp model. Still under 1% off, which is impressive given that I could see the circle segments getting more imprecise in SketchUp as the arc degrees decrease, given that a "circle" in SketchUp is actually a 24-gon which makes this 45° arc a trapezoid.
✅ So we know that the calculations that are happening in JavaScript are matching what is seen in the SketchUp model.
Real World
Since making this I've used it once and can say it's not way off. The calculator said about 850 bushels remained, and this all fit in a ~1000 bushel truck with some room to top off from another commingled bin.
As I have elevator tickets for bin finishings I will track the exact accuracy of this. If you use this calculator and have calculated vs actual numbers, please send them to me so I can adjust the formula if needed.
Each winter brings with it another seed buying decision and thus another opportunity to make some spreadsheets to overanalyze said decision. I continue to look for better ways to compare profitability between differing yield/price seed brands, so I made this simple matrix spreadsheet as a quick reference guide for breakeven yields on differing seed prices.
These breakeven bushel calculations are pretty straightforward to do, but it always feels annoying to have it as a one-off calculation for a specific pair of seeds and takes some time to do in the moment. The idea of this matrix is to be a quick lookup you can do on any two prices in the middle of a seed discussion.
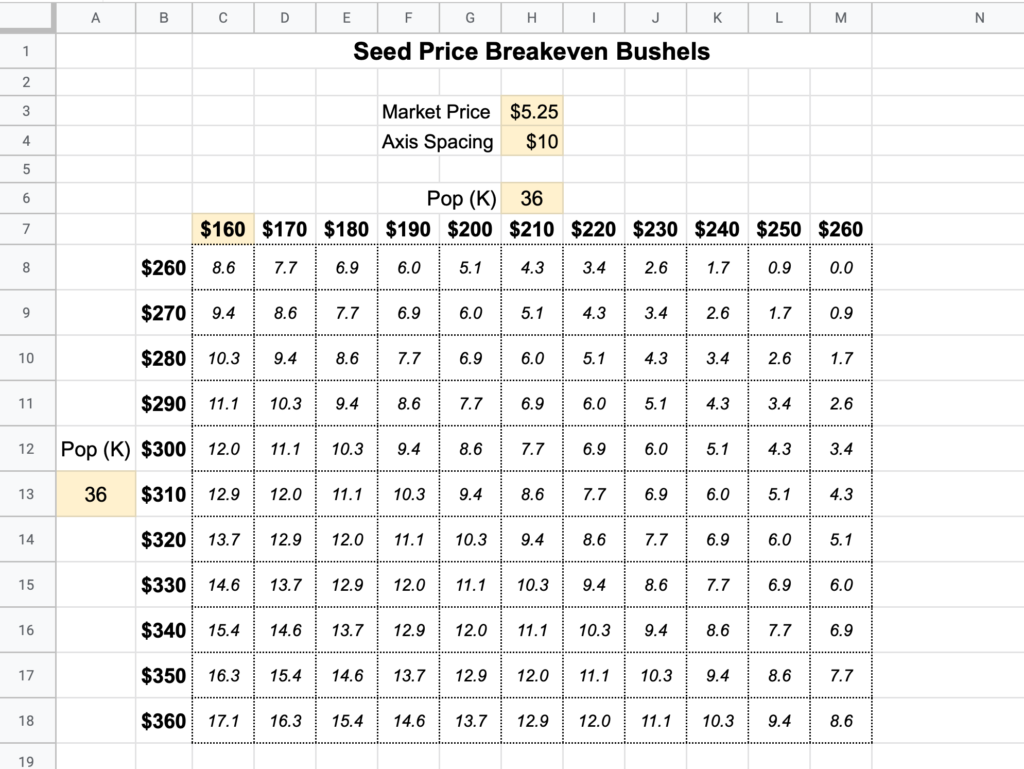
The input fields are highlighted in yellow. You specify:
Market price of the commodity
How many dollars each row/column should be spaced
Price (per bag) to set low end of horizontal axis
In the example above, cell B8 points to the value of cell M7, so an adjustment to the $160 starting price will also flow over to the vertical axis.
Seeding population for each axis
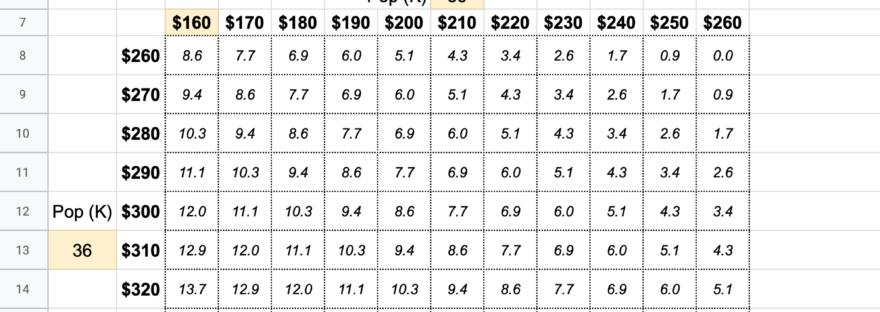
The resulting numbers in the matrix represent how many bushels/acre it would take for the seed price on the left to be more profitable than the seed price on the top.
Alternate Configuration
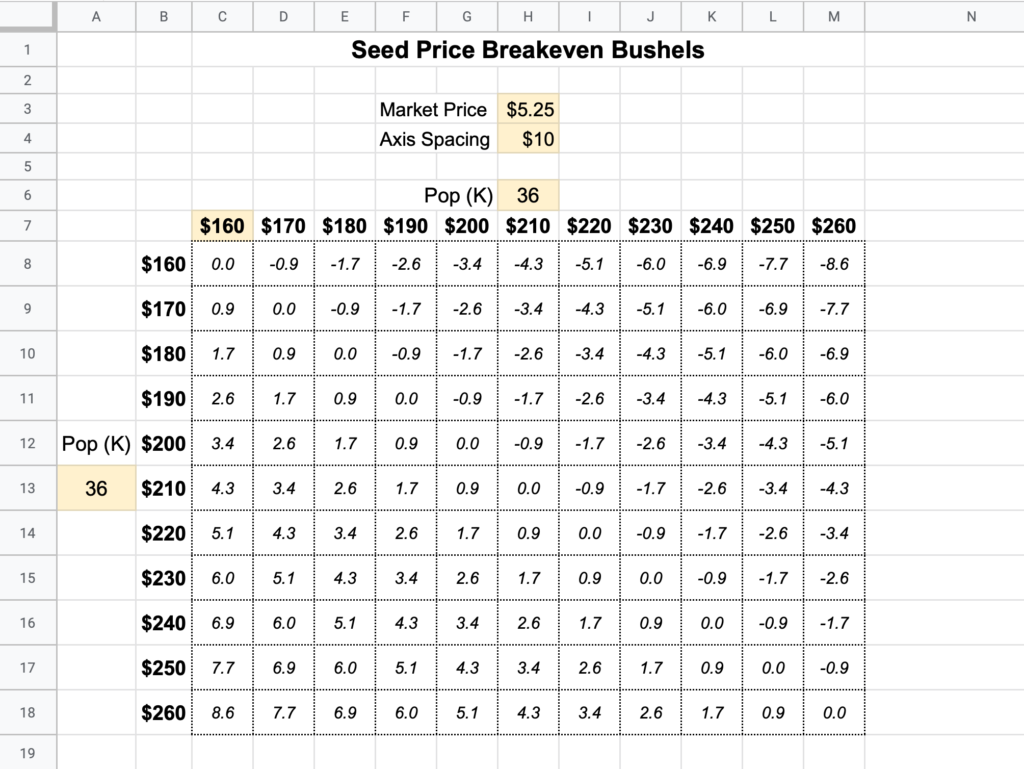
The above example is good for huge variances in price (like between the $200 and $300 area) but it assumes both prices won’t be above or below $260.
For smaller variations that don’t safely reside on one side or the other of a middle price, consider setting cell M8 equal to C7. This will give you a symmetrical matrix with less range coverage, but more flexibility.
In this mode it will be less obvious which axis is the comparison variety, but you can look to the extreme corners in the upper right or bottom left to get your bearings if you forget the format.
Download
Here’s a link to a copy of this in Google Sheets. I’ve primarily used this for corn, but the spreadsheet also includes a soybean tab which uses a 140K seeds / unit calculation instead of 80K.
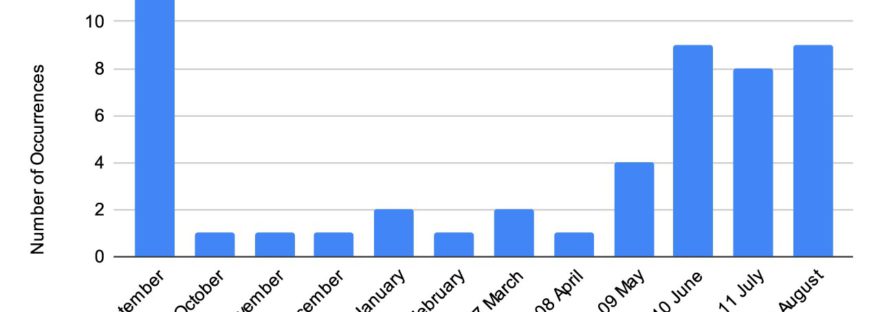
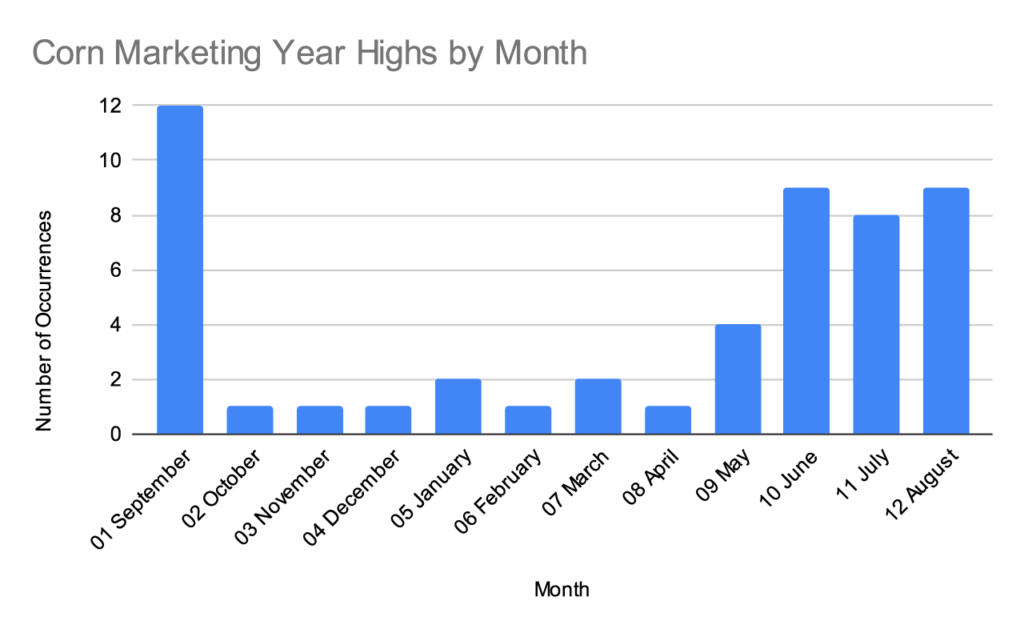
Our market advisor periodically publishes a histogram that shows how many times a marketing year high in corn or soybeans has occurred in each month, starting with the 1970/1971 marketing year.
I won’t republish their exact chart, but this graph is created using the same data.
Full data set since 1970
The last time I looked at their histogram, I noticed how many of the data points in the September corn column were from the 1970s and 1980s. A lot has changed since then- South American production, changing weather patterns, more information technology at the USDA- and I wondered if the timing of the marketing year highs have shifted over time.
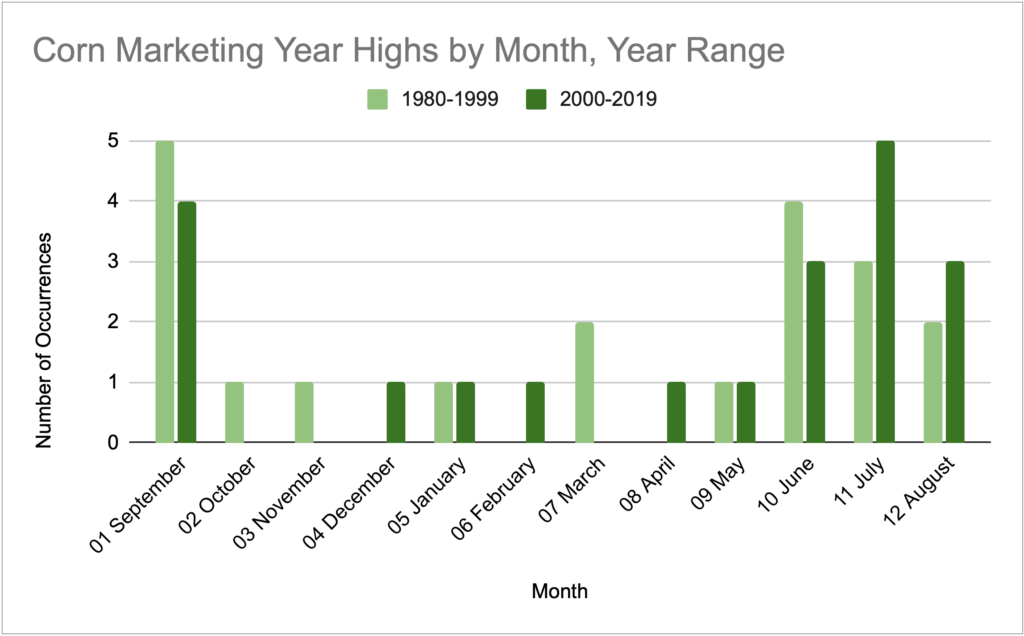
This was hard to visualize in their histogram, so I typed the data into my own spreadsheet and made a split bar graph to compare 1980-1999 with 2000-2019.
Corn
Nothing wildly different here. The most notable change is the decrease in highs in September and the increase in July.
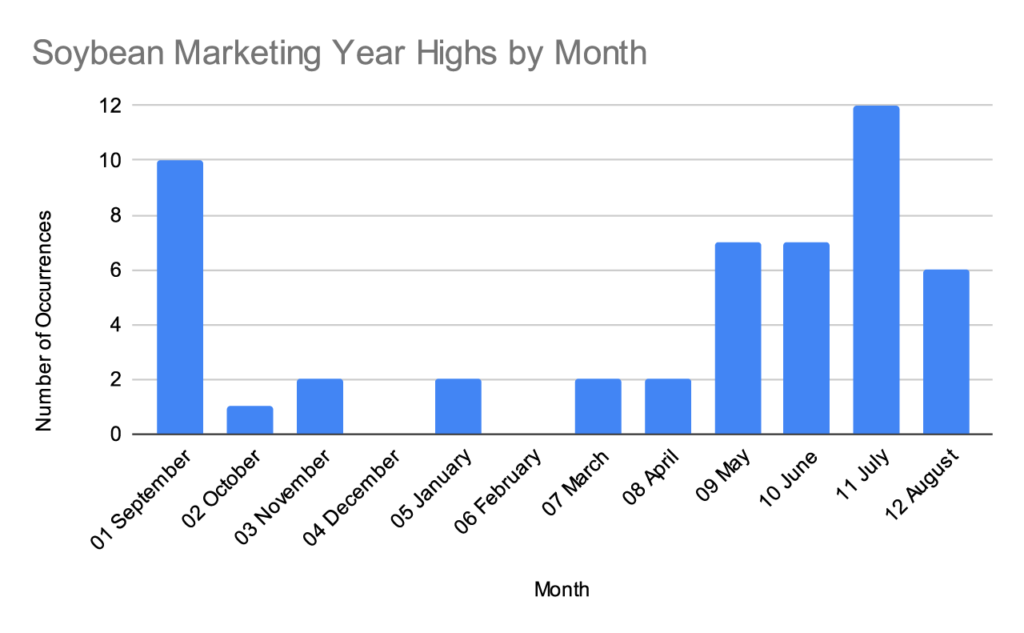
Soybeans
For consistency with the first corn graph provided, here’s a soybean graph starting at 1970.
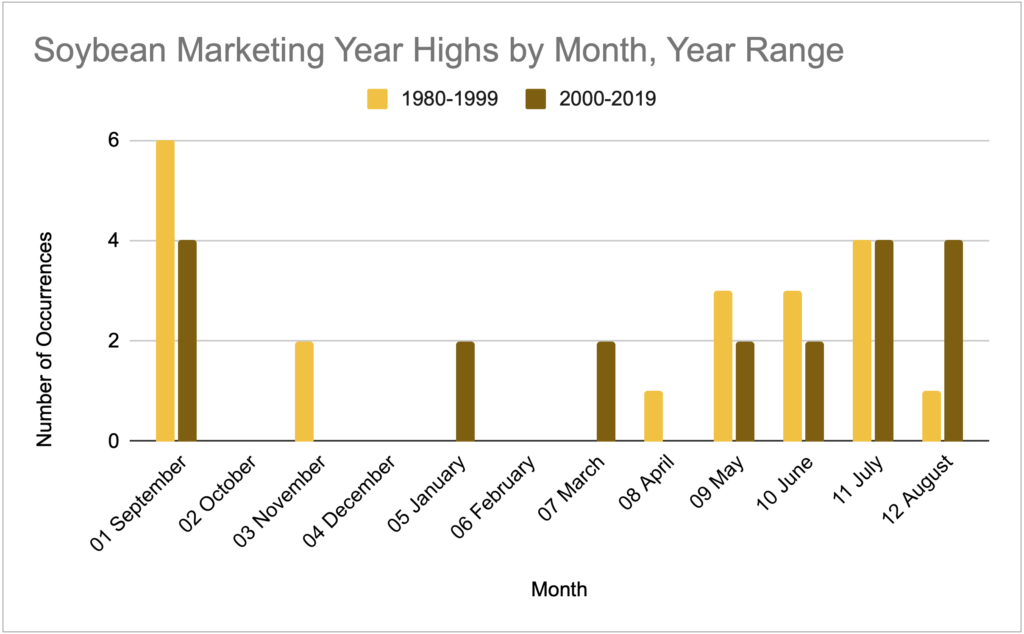
Then here’s the 20 year comparison.
If you’d like to approach this soybean chart with a South American narrative, it will support it. In the last 20 years you see a flattening of the seasonal pattern and the emergence of a few highs in January and March.
Raw Data
Attached is a CSV of the data if you’d like to dig deeper. This is technically cash price data for central Illinois so there could be some basis slippage to board prices.
Note: the Crop Year column is a single year and refers to the first year in the marketing year. (2020 Crop Year = 2020/2021 Marketing Year). I prefer working with 1 year in the raw data and converting back to a readable form as needed.
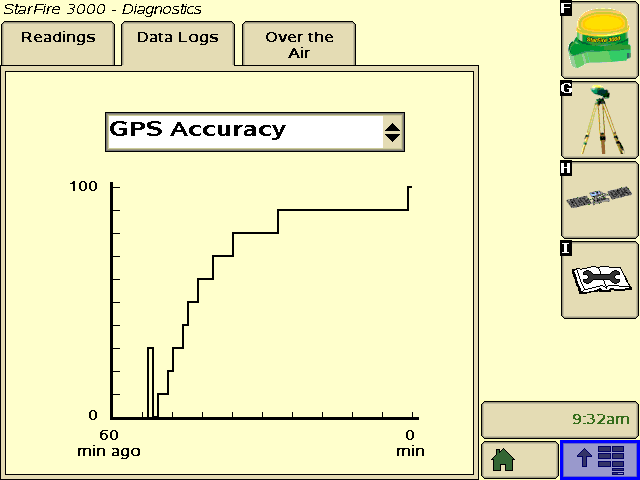
StarFire 3000 globes currently sell for $one arm and a leg, while 6000s sell for $one arm and two legs. If you’re shopping between the two and don’t need SF3, one of the most important improvements of the 6000 is the faster pull-in time. We have one of each on our farm and the repetitive days of fall tillage allowed me to do some real-world comparisons between each.
Data Collection
I collected this data across 6 days in early November (3 days with each globe) in mostly clear skies and flat open fields. Each morning I would keep an eye on the GPS accuracy graph in the StarFire > Diagnostics > Data Logs page, then take a screenshot once it reached 100%.
In each case, the tractor had been operated the day before and was put in a shed overnight. Both are using SF1 and running on a 2600 display.
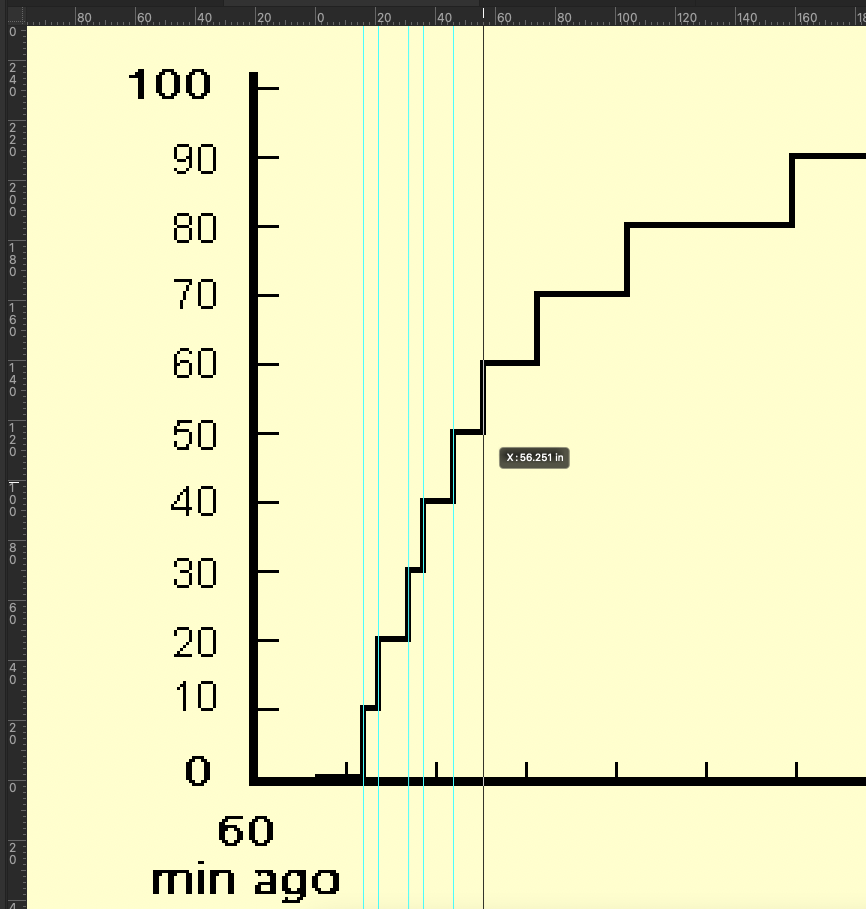
Data Extraction
These screens are 640 x 480 pixels, and as it turns out the x-axis of this data log graph is 300 pixels wide. I ran these through a batch process in Photoshop to add y-axis labels at the 10% marks and to adjust the pixel density to 1 pixel per inch. Then I set the zero point of the ruler to the time the receiver turned on. Once this is done, I can drag a guide to a step on the graph and the tooltip will tell me how many inches (pixels) that is from the start point. Record these values in a spreadsheet, divide my 5 (pixels per minute), and you have data that should be accurate to about a minute after adjusting for the thickness of the line.
This is the part where someone will probably ruin my Photoshop fun and tell me there’s a way to export this data to a CSV in some kind of diagnostics function.
Throughout all of the frequent rains we experienced this summer, my catchphrase was “what a time to be a fungus”. If there was ever a year we should see a fungicide response it should be this one and it penciled out favorably in most of our cases.
Corn Fungicide
We sprayed all our corn acres with Trivapro plus 1 pint / acre of Brandt’s B-Mo micronutrient product. Most of our acreage was applied via airplane through Brandt while several of our larger fields were custom hired with a ground sprayer.
Brandt Aerial Spray
Cost
$ / gallon
oz / acre
$ / acre
Trivapro
$ 197.72
13.7
$ 21.16
B-Mo
$ 35.86
16
$ 4.48
Masterlock
$ 64.32
5
$ 2.52
Plane Application
$ 9.00
Total
$ 37.16
Response
If you’ve read my article on the corn plot, you may recall that we weren’t able to see a measurable response from the check strip across the plot and the applicator didn’t leave check strips in any other fields that we’re aware of. Not requesting more check strips in other fields was a regretful oversight on our part but we’re at least comforted by having a record corn crop that came from some combination of unisolated causes.
Custom Hire Hagie
Cost
$ / gallon
oz / acre
$ / acre
Trivapro
$ 139
13.7
$ 14.87
B-Mo
$ 35.86
16
$ 4.48
Hagie Application
$ 7.50
Total
$ 26.85
Response
The same summer rains that increased the need for a fungicide also made the ground muddy and hard to drive a sprayer across, so our ground application near brown silk was less timely than it could have been. We were still able to measure a 9.2 bu/acre average response.
Planting Date
Spray Date
Variety
Method
Response
April 2
July 15
Nutech 74B6AM
Ground
+ 9.0
April 6
July 15
Wyffels 7956
Ground
+ 8.4
April 7
July 19
Wyffels 7888
Ground
+ 5.8
April 7
July 19
Wyffels 7696
Ground
+ 13.4
Average
+ 9.2
Profitability
✅ This response is profitable at a corn price higher than $2.92
Soybean Fungicide
This was actually our first year spraying a bean fungicide which we did entirely ourselves with a pull-type sprayer. None of our beans were super tall this year and we followed our herbicide tracks so the plant damage appeared to be minimal.
For chemicals, we applied Cover XL (generic Quilt) and Lambda (generic Warrior) plus added some Brandt micronutrients in half of the loads. This was applied at what we considered R3, although the period at which you can find some 1/4″ pods while more are being added seems wide and ambiguous.
Reduced Data Set
While we sprayed every field with a fungicide and tracked everything in our monitor, not all the data was usable or fair. In several cases, the check strip would be too close to the edge of the field (or even along the edge) which would include some of the headland in the comparison. We angle cut our beans, and even though overlap control is enabled and somewhat helpful, we do still get this sawtooth pattern of low yields.
Most of the data I allowed for use was in the middle of the field and included a check strip which could be measured from both sides to account for a potential gradient change across the field.
Fungicide/Insecticide Only
Cost
$ / gallon
oz / acre
$ / acre
Cover XL
$ 59
19.2
$ 8.85
Lambda
$ 35
3.84
$ 1.05
Surfactant
$ 8
4.8
$ 0.30
Sprayer Pass
$ 6.50
Total
$ 16.70
Response
Planting Date
Variety
Response(vs unsprayed check)
April 16
Nutech 39N05E Nutech 35N03E
+ 3.8
April 19
Pioneer P34T21SE Pioneer P38T76E
+ 5.2
April 19
Pioneer P34T21SE Pioneer P38T76E
+ 2.8
Average
+ 3.9
Profitability
✅ This response is profitable at a soybean price higher than $4.28
Fungicide/Insecticide/Micronutrients
Cost
$ / gallon
oz / acre
$ / acre
Cover XL
$ 59
19.2
$ 8.85
Lambda
$ 35
3.84
$ 1.05
Brandt B-Mo
$ 35.86
16
$ 4.48
Brandt Smart Trio
$ 18
~20
$ 2.81
Surfactant
$ 8
4.8
$ 0.30
Sprayer Pass
$ 6.50
Total
$ 23.99
Note: the Smart Trio called for 16oz / acre, but we went slightly over to make jugs come out evenly on sprayer loads
Response
Planting Date
Variety
Response(vs unsprayed check)
April 26
Pioneer P38T76E
+ 3.4
April 27
Pioneer P38T05E
+ 3.8
May 7
Pioneer P38T05E
+ 4.9
May 13
Pioneer P38T05E Stine 39EA02
+ 3.0
May 13
Stine 36EA02
+ 3.1
Average
+ 3.6
Profitability
✅ This response is profitable at a soybean price higher than $6.66
To Micronutrient or Not?
The responses in each of the previous examples were compared to an unsprayed strip. In several fields we had micronutrient and non-micronutrient strips next to each other to calculate a fair response, but due to unreliable data near field edges or poor areas only one of these comparisons was reliably usable.
Planting Date
Variety
Micronutrient Response
April 16
Pioneer P39N05E
+ 0.3
The additional cost of the micronutrients is $7.29 / acre, so a 0.3 bu / acre response would only be profitable above $24.30 soybeans. I won’t dismiss the product on one data point though as I know adding micronutrients to a fungicide pass is popular for many growers, so I’d be curious to try this again next year with more intentionality about where the adjacent strips are placed and hopefully have better data.
This plot location is well drained and pretty consistent in soil type (mostly Herrick, some Virden on the west end of the rows). We planted the plot rows perpendicularly to the direction we apply fertilizer and spray to make any streaking consistent across varieties. Each variety is 16 rows x 500 feet, with 16 rows of a check variety in between each tested variety. We weighed each strip using a 20 lb precision grain cart and took 3 moisture samples per strip using a Dickey-john M3G.
Shrink Formula
I shrank the dry yield to 15% using a shrink factor of 1.176 as per this article from Pioneer. Our Wyffels representative used the following common yield equation formula:
(100-Moisture)*(109.815)*(Weight of wet bushels)/(rows)*(length)*(row spacing)
His dry yield figures came out effectively the same as what I already computed with the 1.176 factor.
Yield Adjustment Formula
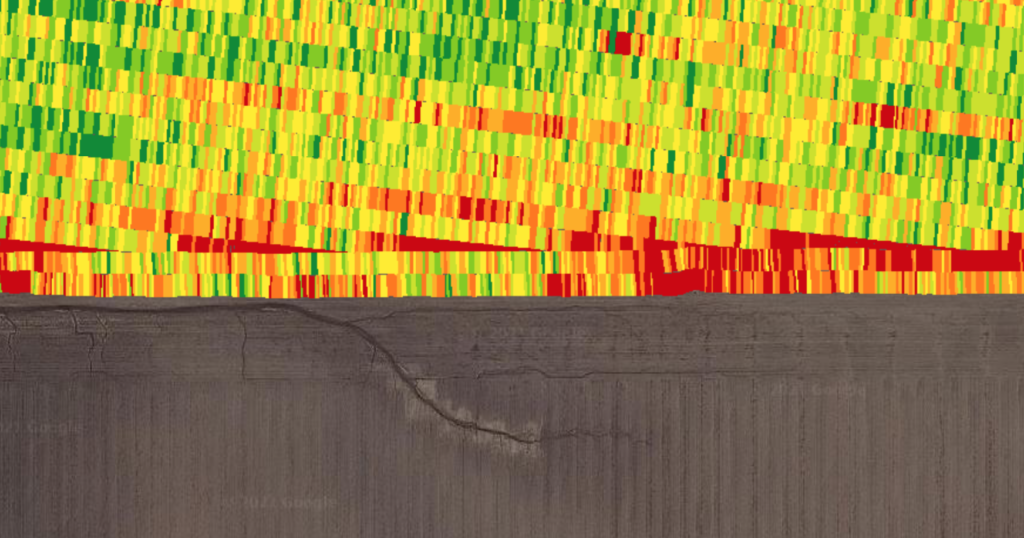
While the field doesn’t experience any wild productivity deviations, the inclusion of check strips allows for indexing each variety against the check strip and making more accurate absolute comparisons across the plot. My formula for this first calculates the performance of the variety as a percentage of the average of the adjacent check strips. Then, it multiplies that percentage by the average of the check variety across the entire plot (P1185AM in this case, which averaged 261). Assuming your check variety can act as a measure of general corn suitability, this should give you an actual yield figure close to what that variety would have done if planted solidly across the plot.
This flattens the variance in the field productivity, lowering the high spots and raising the low spots. This animation visualizes this well:
Adjusted Dry Yield Results
Variety
Moisture
Adjusted Dry Yield
Wyffels W7696
19.4%
268
Wyffels W7956
19.8%
268
Stine 9808E-20
20.4%
267
NuTech 74B6AM
18.4%
266
Wyffels W7876
18.6%
265
Wyffels W7888
19.3%
262
Pioneer P1185AM (check)
18.0%
261
Pioneer P1108Q
18.4%
258
Wyffels W7456
19.7%
257
Wyffels W7878
19.0%
255
Stine 9734-G
19.0%
252
Stine 9746-20
18.3%
246
Stine R9734-32
20.2%
244
I have not attempted to calculate a proper least significant difference for this data, but a quick and dirty technique I’ve heard is to calculate the standard deviation and use that as a stand in for the LSD. The standard deviation is 8.0 for both the adjusted dry yields in this table as well as the unadjusted dry yields of all harvested strips.
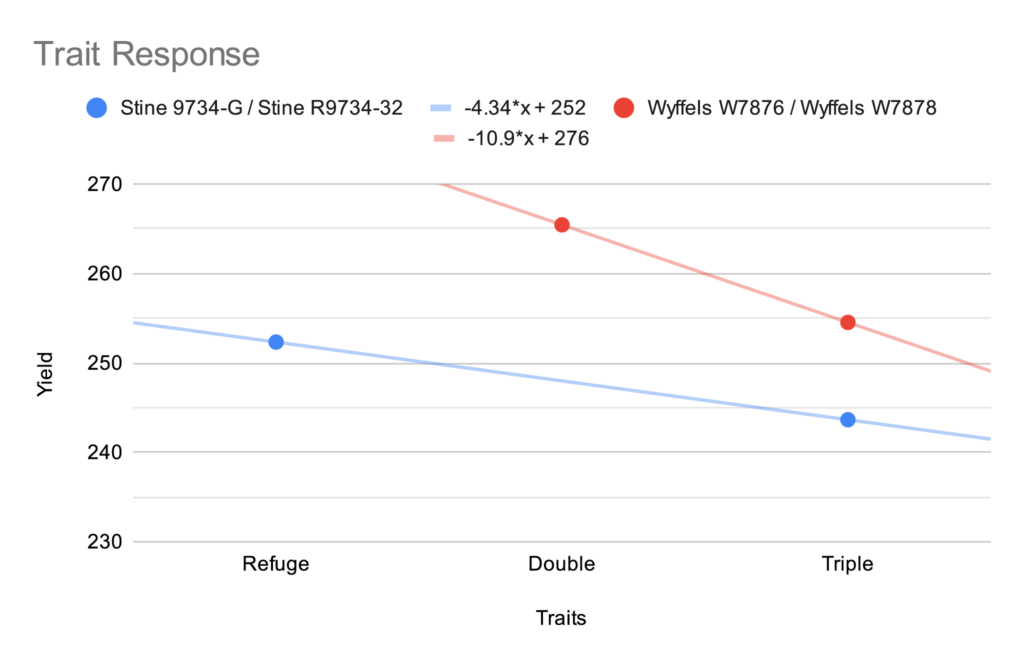
Trait Response
Two pairs of the varieties in this plot were the same underlying hybrid in different trait packages. We have not seen corn rootworm pressure in our area and wanted to test what response we’re seeing from the additional trait insertions.
Roundup
Double Stack
Triple Stack
Stine Hybrid
9734-G
R9734-32
Wyffels Hybrid
W7876
W7878
Given the absence of pest pressure, we saw a 5-10 bushel drag for each additional trait.
Seed Profitability Analysis
I’ve often seen people use a breakeven seed cost calculation that compares two varieties, usually starting from the perspective of cheaper variety A and asking (at a given market price) how many bushels it would take to pay for variety B. In this case we have 13 varieties (of which there would be 78 different pair combinations) and already know the yield performance difference in this plot. For this reason I prefer to calculate the seed on a cost per bushel basis which accounts for all the factors and can be ranked across the list without pairings.
Simply divide the seed cost per acre by the yield, right? Eh, this could be problematic. While this will technically give you cost per bushel, it hides the fact that all your other fixed costs will go up or down on a per bushel basis as the yield changes. This will tend to make cheaper, lower yielding varieties look artificially profitable. Imagine a thought experiment in which seed variety A costs $0.40 / acre and makes 1 bushel / acre. Seed variety B costs $115/acre and makes 230 bushels/acre. Variety A is technically $0.10 / bushel cheaper, yet in that scenario your other expenses would be hundreds of dollars per bushel.
For this reason, I account for all the other fixed costs and calculate a holistic breakeven bushel price.
((all non-seed expenses per acre) + (this variety's seed cost per acre)) / (this variety's yield)
I used a non-seed expense of $700 which isn’t out of line with the University of Illinois’ 2021 crop budgets and is a nice round number.
Variety
Total Cost per Bushel
Stine 9808E-20
$2.91
NuTech 74B6AM
$3.01
Stine 9734-G
$3.03
Wyffels W7696
$3.04
Wyffels W7956
$3.06
Wyffels W7876
$3.11
Pioneer P1185AM (check)
$3.16
Wyffels W7456
$3.17
Stine 9746-20
$3.19
Wyffels W7888
$3.20
Stine R9734-32
$3.28
Pioneer P1108Q
$3.30
Wyffels W7878
$3.36
If there’s a flaw in my logic here or there’s a better way to rank seed profitability across many varieties, let me know. I’d be happy to adjust methodologies.
Fungicide Response
Ready to be disappointed?
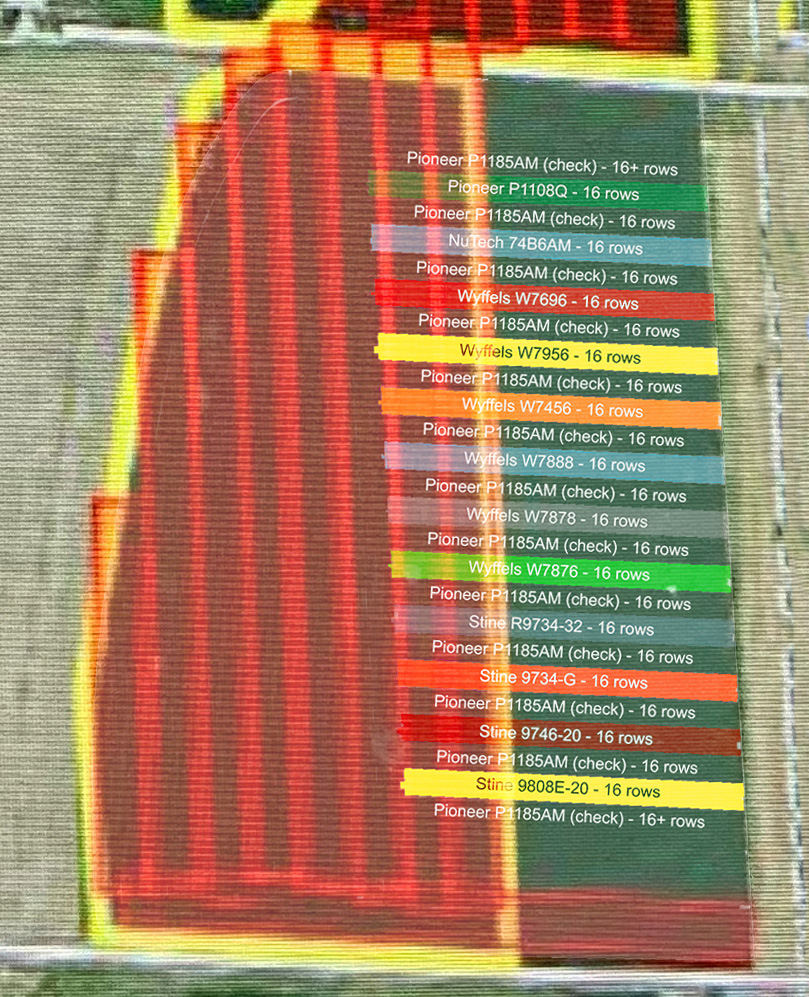
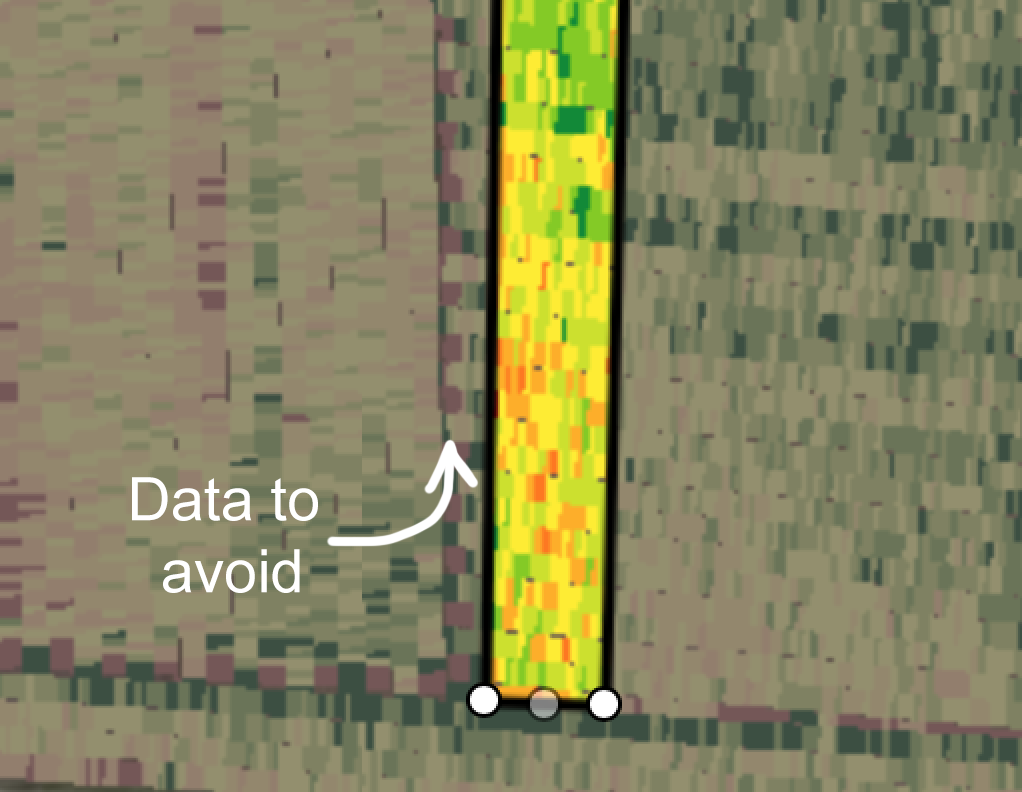
If you’ve seen my article on manually logging a coverage map in John Deere Operations Center, you may recall how this field was partially sprayed with an aerial fungicide. Our goal was to have half of the plot sprayed and measure a fungicide response per variety across each plot row. How neat would that be?
Problem #1: “Half” Turned into “Fifth”
Aerial application map overlaid with plot
Our plot rows are 500′ long and the spray plane swath is 80′. Three swaths would have been a nice 240′, but four swaths were left unsprayed instead, so 320′ unsprayed, 180′ sprayed (in theory). Two factors whittle down that sprayed length even more; the plane bore slightly too far west, and I didn’t want to include the volatile yield map data right at the edge of the plot as the combine is entering/exiting a pass.
After also accounting for the slight angle mismatch of the eastmost swath, the usable sprayed area was about 90′ long.
Problem #2: Planes are Imprecise
Historical weather data shows the wind peaked at 10mph out of the west the day this was sprayed. From watching the mist fall patterns of spray planes, it’s very believable that a decent amount of eastward drift occured- but how far exactly? Even if you could calculate this drift, how sharp of an edge would you expect to see if measuring polygons?
Future Plans
I’d like to revisit this split fungicide treatment in the future and perhaps have it applied with a ground sprayer to have better precision over the application area.
I’d also like to continue to see how seed profitability comparisons fluctuate year to year. We had a very good growing season for corn this year, just a bit wet. It would be interesting to see how premium/cheaper varieties handle more adverse seasons.
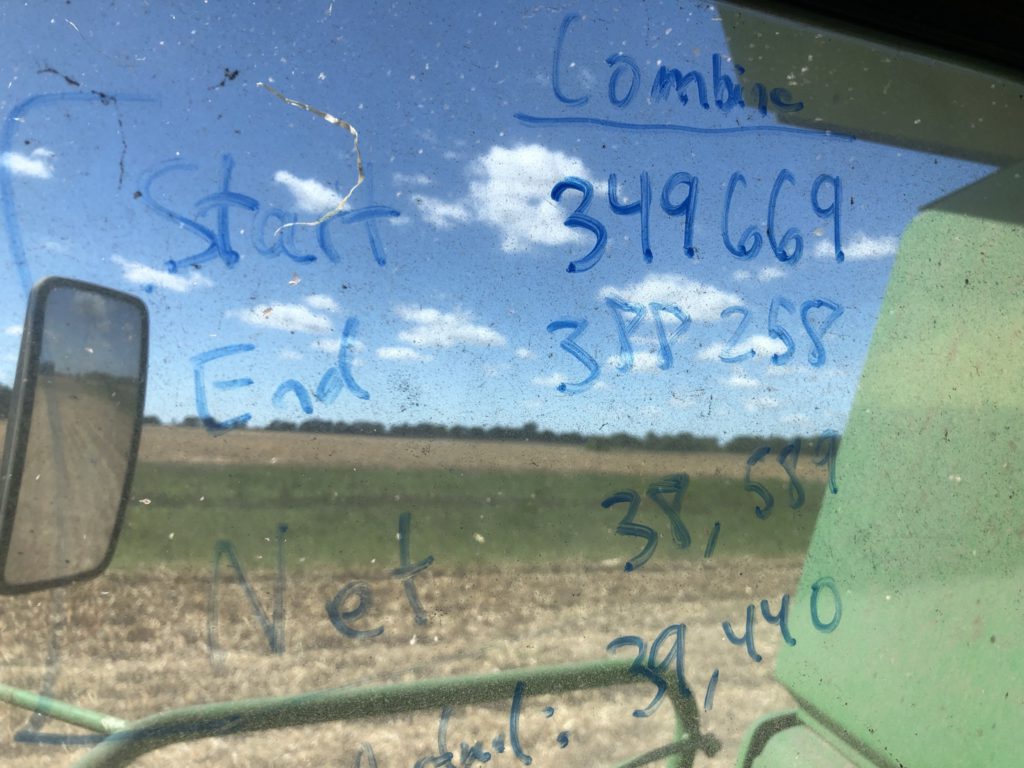
One thing I miss about working in an office is the ubiquity of whiteboards for jotting a note or fleshing out an idea. If you’ve seen the algorithm scene from The Social Network, you’ll have a hunch that dry erase marker can be used on glass. Fortunately in this case, it actually does work as well as the movies.
Take field logistics to the next levelTotal pound jottings for yield monitor calibration
Will this come off the glass?
Yes- in my experience, this comes off with no residue or ghosting of the glass. In the spring of 2020 I jotted some common headings for tillage and forgot to erase them until I got back in this tractor in the fall. I was surprised with how easily it still wiped off with a dry paper towel without leaving any residue.
This spent the summer of 2020 on this tractor glass and came off easily in the fall.
This is an enhancement to the wiki server I use to document equipment and processes on our farm. Here is the initial article if you haven’t read it yet.
On my farm wiki server I have several pages with checklists for equipment prep and found myself wanting to check off each item as I work through the checklist. I created a simple template for a toggle checkbox that can be dropped in on any page to track completion.
Wiki Templates
In a MediaWiki server, a template is a saved chunk of HTML that can be reused anywhere in the site. This allows you to make something once and easily reuse it across the site without duplicating all the formatting and markup each time. Here’s MediaWiki’s template help page for more information.
Once this is all set up, I can add a clickable checkbox anywhere on a page by adding the following template reference:
{{Template: checkbox}}
Setup
In addition to creating the template, we’ll also need to add some custom CSS and Javascript to the common files in the wiki server. In order to easily access each of these three locations, I recommend creating a utility page to link to these obscure pages without manually typing in the URL and forgetting where these live in case you want to make changes down the road.
1. Create Utility Page
From the home page (or wherever is out of the way and accessible) create a link to a new page which will host links to these other pages that need to be edited. I called mine [[Wiki Utility Pages]] and put it at the bottom of my home page.
Once you open that link, paste in the following links:
Once you save this page, you should see the first two links in blue (since those files already exist) and the template link in red.
2. Add Custom CSS
Open the first link (Common.css). You should see an initial line at top that says “CSS placed here will be applied to all skins”. Edit the file and paste the following CSS below that line (and under any other CSS that may already be there)
This creates a function with the logic to invert between the checked and unchecked styles. The bottom line attaches this function to all elements with a class of “listCheckBox”
4. Create Checkbox Template
Lastly, follow the link to the checkbox template to create the template. Paste the following code in:
Google Forms is one of my favorite data intake tools for its simplicity, ease of multi-device access, and price. I use a Google Form to digitize scale tickets which helps share the information between people (a truck driver can log a ticket and I can see it in a Google Sheet instantly) and of course makes totaling and moisture averaging much faster.
This article will highlight how I’ve structured my form and accompanying spreadsheet, instructions for setting up your own copy, and explanation of some custom Google Sheet functions I wrote to help with multi-entity ticket splits.
Which Data Points to Log
From a technical standpoint, a Google Form can log as much data as you want, but do you want to sit at the scale for 3 minutes filling out every data point on the ticket? Of course you won’t, so it would never get used.
What I chose to log
Ticket number
Date (leave it blank to default to current day)
Location
Commodity
Moisture
Bushels
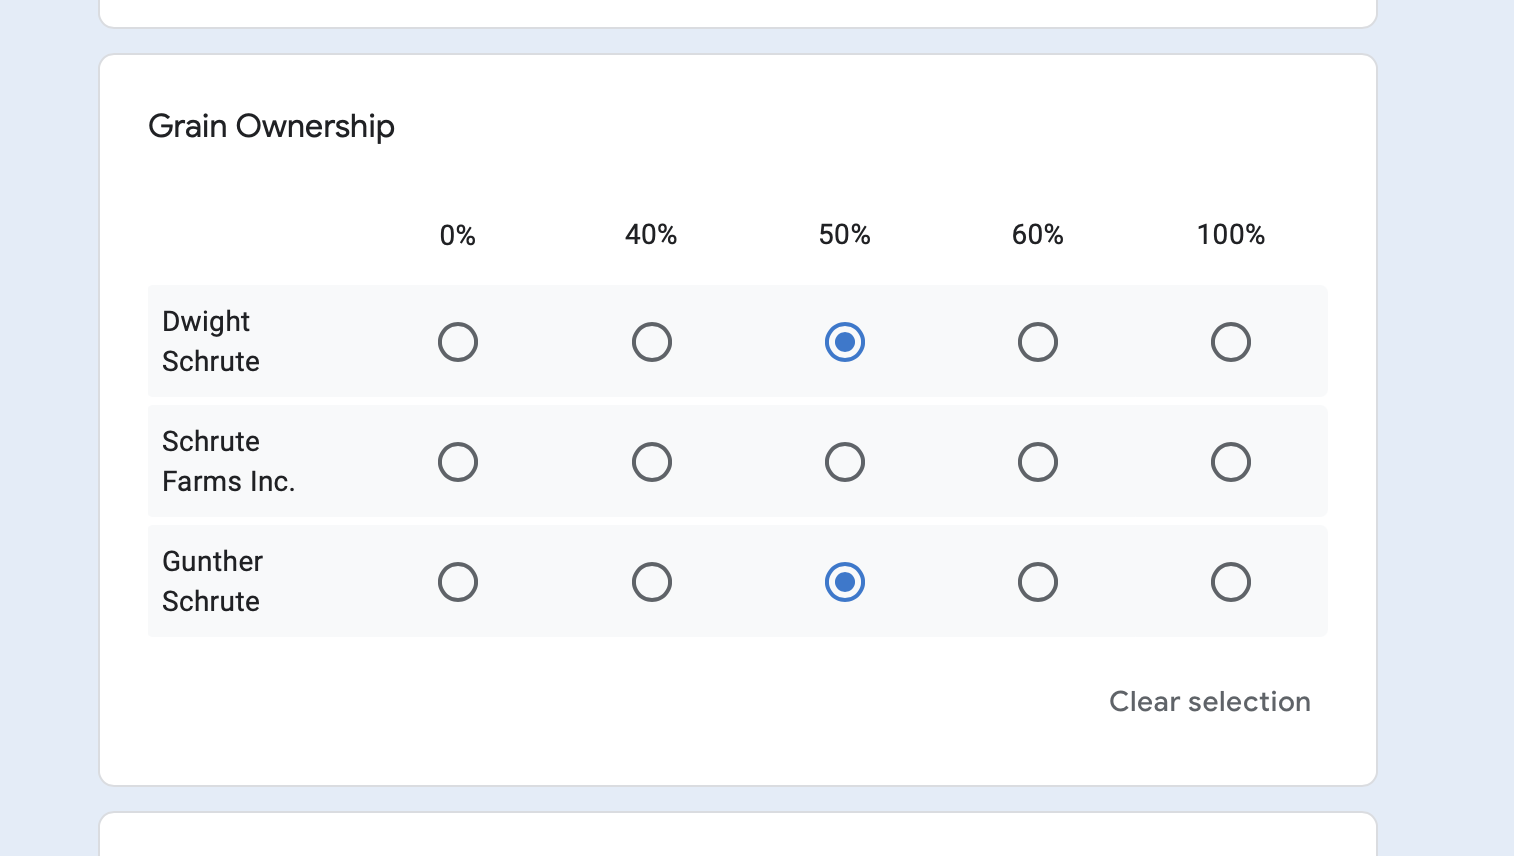
Who owns what percent of the grain
(Example of multi-select grid for grain ownership, which is greatly assisted by the custom function featured later)
[Optional] Which bin/field did the grain come from?
Only 3 of these fields need to be typed in with a keyboard (ticket number, moisture, bushels) where as most of the others can be selected from a pre-populated radio button list or derived like Date.
In my experience, you can fill out a form within about 30 seconds after pulling off the scale which feels usable and not a logistical hinderance.
What I chose to not log
Delivery type (contract, storage, spot, etc)
Some tickets are split between multiple delivery types, so how would this be accounted for in a normalized way?
Which specific contract this is delivered against
The contract numbers would change each month and year, so you’d either have to retype them each time, or manually add them all to a radio button selection on the form
These are your decisions to make based on your operation, but there is a cost of added complexity to balance against better data. I felt it would be better to have rudimentary ticket data that everyone in the operation consistently uses than a perfect solution that’s too detailed for anyone to fill out.
Setting Up Form
If you’d like to set up your own form from scratch it’s pretty straightforward, plus there are many of great tutorials you can find online. In this section I’ll cover how to copy my form to your Google Drive.
2. Open the Google Form. Go to the Responses tab, click the 3 dot menu button, then “Select response destination”
3. Click select existing spreadsheet, then click Select. Navigate to the scale ticket spreadsheet in your Drive and select it.
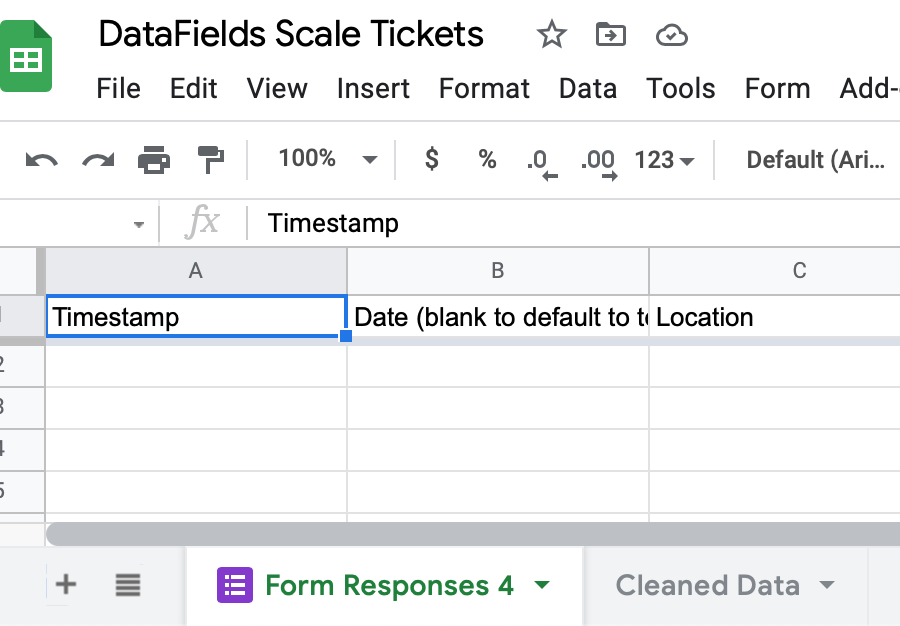
4. Now go to the scale ticket spreadsheet. You should have a sheet with a purple Google Forms logo called something starting with Form Responses. Click the dropdown arrow and rename it to something more natural, like “Scale Tickets”.
5. Now go to the Cleaned Data sheet and update the formula in cell A1 to reflect this name change as shown below. Notice the A:S selector; this will automatically include all rows, even as more are inserted.
You’ll get an error in this cell, but that’s because you don’t have any data yet.
6. Go back to the Google Form. I’ve included a few boilerplate locations and entities as an example which you’ll want to replace with your own.
7. Once you have those updated, click Send and you’ll have several options for sharing a link. Any changes you make in the future will be live at this link, so you don’t have to get everything perfect before sharing the link to your other people/devices.
You should now have the bare bones working: a form you can fill out on any device which will populate the raw “Scale Tickets” sheet, and a “Cleaned Data” sheet which you can use to create a pivot table or chart. I’ve included 2 simple pivot tables showing daily totals by owner and location. You can easily make your own or adjust these to your needs.
Custom Functions
So what’s special about the “Cleaned Data” sheet? I’ve written 3 custom functions to clean and rearrange the raw form data; explaining what each formula does will provide an understanding of the difference between the form data and Cleaned Data.
removeDuplicates does exactly what you’d expect: it takes in the tabular data in the input range position, and one or two column indexes to use in determining unique rows. This is helpful because if you leave a browser on the landing page after submitting a ticket and accidentally refresh the page hours later, you can end up with duplicates.
For example, if column 3 is ticket number and column 4 is location, this will prevent duplicate ticket numbers within each location. In most cases going by ticket number alone is probably enough, but including location prevents the freak chance that you get a ticket #1234 from Elevator A and a different but equally numbered ticket #1234 from Elevator B.
mergeDates(<input range>, <timestamp column index>, <manual date column index>)
Remember how the form includes a field to manually enter a date other than the date the form was submitted? This formula checks to see if the manual date if empty or filled. If it’s filled, that’s taken as the date. If it’s empty, it populates it with the date/time the form was submitted. All of this goes in a simple “Date” column. This makes the form much faster to use by eliminating another field that has to be filled out, especially one that annoyingly has separate input fields for day/month/year.
This formula is the most complex but also quite helpful. In a nutshell, it splits up tickets that are owned by multiple entities into multiple smaller tickets each owned 100% by an entity. Instead of having a wide table with many columns of ownership percentages, you end up with a skinnier table which is much easier to query and aggregate in pivot tables.
The ownership column prefix (“Grain Ownership” in this case) tells the script which columns to extract the owner name from and process percentages, and the bushel column name is used to identify the column with the total number of bushels for that ticket.
Example of original data with multiple owner columns:
Ticket Number
Date
Location
Bushels
Grain Ownership [Dwight Schrute]
Grain Ownership [Schrute Farms Inc.]
Grain Ownership [Gunther Schrute]
1234
9/15/2021
Mongous Grain Company
950
50%
50%
4321
9/16/2021
Springfield Farmers Co-Op
1080
100%
Below is the normalized data with one owner column and multiple rows as needed.
Ticket Number
Date
Location
Bushels
Owner
1234
9/15/2021
Mongous Grain Company
475
Dwight Schrute
1234
9/15/2021
Mongous Grain Company
475
Gunther Schrute
4321
9/16/2021
Springfield Farmers Co-Op
1080
Dwight Schrute
Taller/skinnier tables like this with known number of columns are much easier to work with in pivot tables and charts.
So to recap, the cleaned data has all duplicate tickets removed, fills the date column accordingly, and normalizes the ownership data into a format that is very friendly for queries.
(Required meme any time someone uses the word “normalize” while working in a spreadsheet)
Below is the code for these formulas if you’d like to implement them on an existing Google Sheet. You can add custom formulas by going to Tools > Script editor.
function normalizeColumnSplit(input, ownershipPrefix, totalBushelsColumnName) {

  //get the input column headings from the first row and store them in an array for future reference
  var inputColumnHeadings = [];
  for (var c = 0; c < input[0].length; c++){
    inputColumnHeadings.push(input[0][c]);
  }

  //array of maps for output data
  var outputRowMaps = [];

  //iterate through each row of input
  for(var r = 1; r < input.length; r++){
    //ticketLevelColumnsMap will contain all the columns that apply across all ownership rows
    var ticketLevelColumnsMap = new Map();

    //ownershipMap will contain key/value pairs of owner names and bushel percentage
    var ownershipMap = new Map();

    //iterate through each column of input row
    for (var c = 0; c < input[r].length; c++){
      var cellValue = input[r][c];

      //if the current column contains the ownership prefix, capture the owner name and bushels and set it aside in ownershipMap
      if(inputColumnHeadings[c].includes(ownershipPrefix)){
        if(cellValue > 0){
          var cleanedName = inputColumnHeadings[c].replace(ownershipPrefix,"");
          cleanedName = cleanedName.replace("[","");
          cleanedName = cleanedName.replace("]","");
          cleanedName = cleanedName.trim();
          ownershipMap.set(cleanedName,cellValue)
        }
      //write all other data through as-is
      } else {
        ticketLevelColumnsMap.set(inputColumnHeadings[c],input[r][c])
      }
    }

    //store the total bushels for the ticket to be computed by owner
    var totalTicketBushels = ticketLevelColumnsMap.get(totalBushelsColumnName);

    //for each onwer/bushel pair, set an owner column and update the bushel column with the percentage split
    for (owner of ownershipMap.keys()){
      var outputRowMap = new Map(ticketLevelColumnsMap);
      outputRowMap.set(ownershipPrefix, owner);
      outputRowMap.set(totalBushelsColumnName, ownershipMap.get(owner)*totalTicketBushels);
      outputRowMaps.push(outputRowMap);
    }
  }

  //get output column headings
  var outputColumnHeadings = Array.from(outputRowMaps[0].keys());

  //simple array output with column headings array in first row
  var outputArray = [outputColumnHeadings];

  //step through each row and column of outputRowMaps, convert to a simple 2D array
  for (var r = 0; r < outputRowMaps.length; r++){
    var columnArray = [];
    for(var c = 0; c < outputColumnHeadings.length; c++){
      columnArray.push(outputRowMaps[r].get(outputColumnHeadings[c]));
    }
    outputArray.push(columnArray);
  }

  return outputArray;
}


function mergeDates(dataArray, timestampColumnIndex, manualDateColumnIndex){
  var ouputArray = [];
  for(var r = 0; r < dataArray.length; r++){
    var outputRow = dataArray[r];

    if(outputRow[manualDateColumnIndex-1] == "" && outputRow[timestampColumnIndex-1] != ""){
        var dateObject = new Date(outputRow[timestampColumnIndex-1]);
        var dateOnlyObject =new Date(dateObject.toDateString());
        outputRow[manualDateColumnIndex-1] = dateOnlyObject;
    }
    ouputArray.push(outputRow);
  }
  ouputArray[0][manualDateColumnIndex-1] = "Date";

  return ouputArray;
}

function removeDuplicates(dataArray, columnIndex1, columnIndex2){
  var rowMap = new Map();

  for(var i = 0; i < dataArray.length; i++){
    var column1Value;
    var column2Value;

    if(columnIndex1){
      column1Value = dataArray[i][(columnIndex1-1)]+"";
      column1Value = column1Value.trim();
    }

    if(columnIndex2){
      column2Value = dataArray[i][(columnIndex2-1)]+"";
      column2Value = column2Value.trim();
    }

    var uniqueId = column1Value+column2Value;
    rowMap.set(uniqueId, dataArray[i]);
  }

  return Array.from(rowMap.values());

}