
Table of Contents
Overview
Plot Design
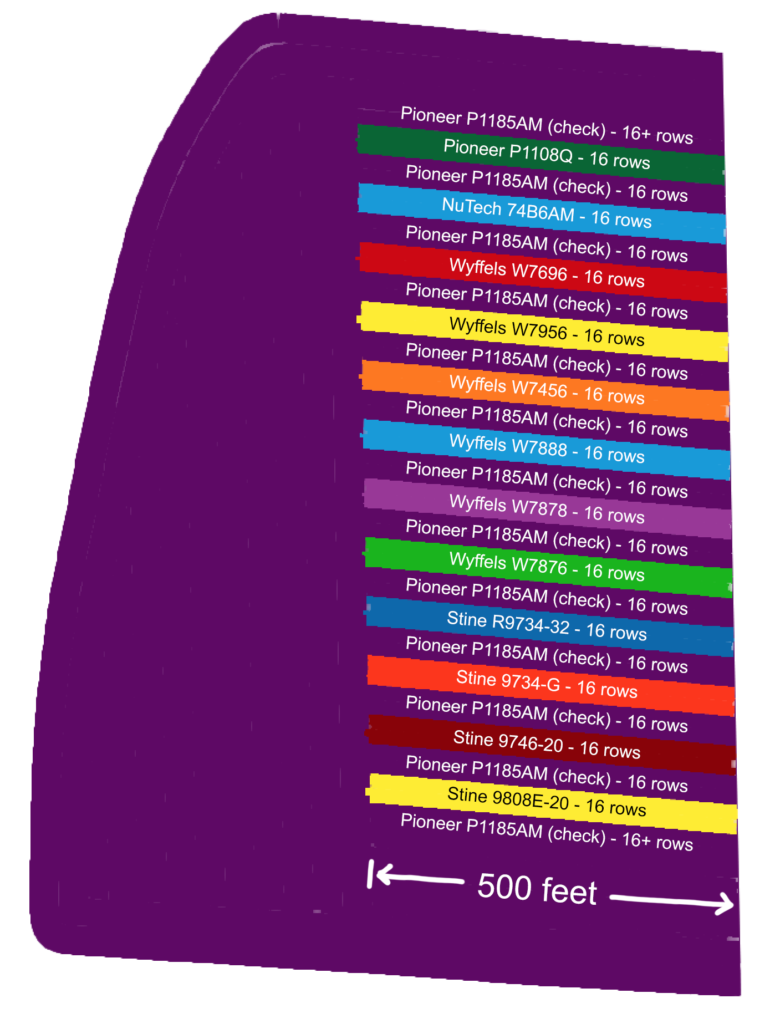
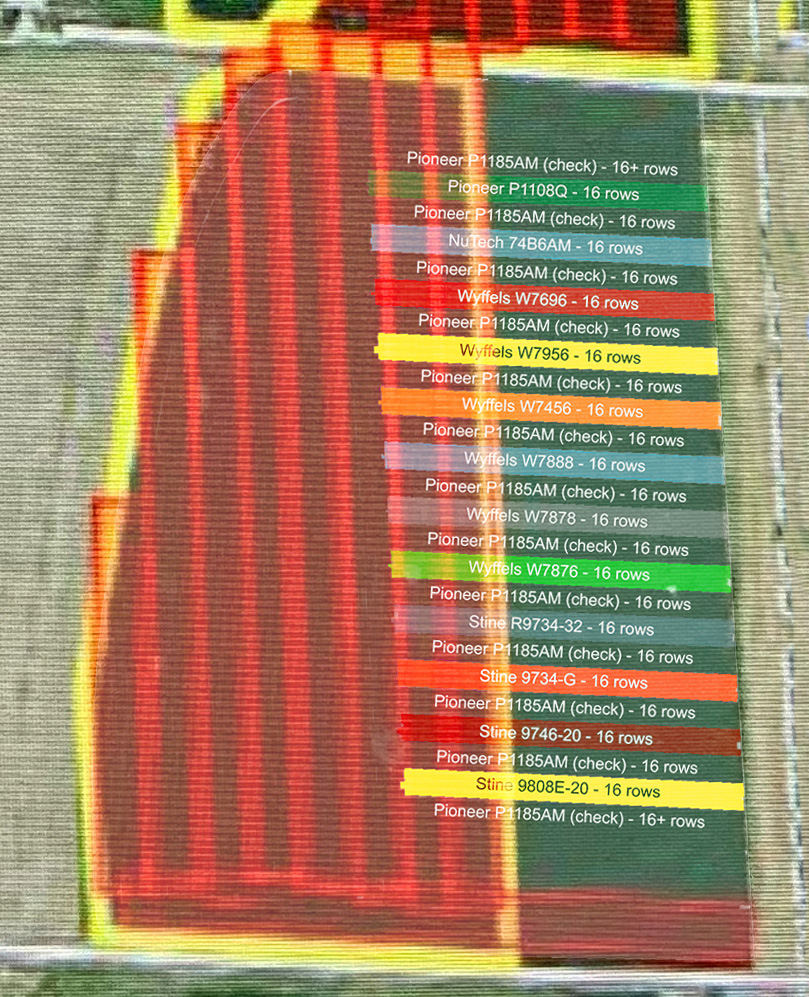
This plot location is well drained and pretty consistent in soil type (mostly Herrick, some Virden on the west end of the rows). We planted the plot rows perpendicularly to the direction we apply fertilizer and spray to make any streaking consistent across varieties. Each variety is 16 rows x 500 feet, with 16 rows of a check variety in between each tested variety. We weighed each strip using a 20 lb precision grain cart and took 3 moisture samples per strip using a Dickey-john M3G.
Shrink Formula
I shrank the dry yield to 15% using a shrink factor of 1.176 as per this article from Pioneer. Our Wyffels representative used the following common yield equation formula:
(100-Moisture)*(109.815)*(Weight of wet bushels)/(rows)*(length)*(row spacing) His dry yield figures came out effectively the same as what I already computed with the 1.176 factor.
Yield Adjustment Formula
While the field doesn’t experience any wild productivity deviations, the inclusion of check strips allows for indexing each variety against the check strip and making more accurate absolute comparisons across the plot. My formula for this first calculates the performance of the variety as a percentage of the average of the adjacent check strips. Then, it multiplies that percentage by the average of the check variety across the entire plot (P1185AM in this case, which averaged 261). Assuming your check variety can act as a measure of general corn suitability, this should give you an actual yield figure close to what that variety would have done if planted solidly across the plot.
This flattens the variance in the field productivity, lowering the high spots and raising the low spots. This animation visualizes this well:
Adjusted Dry Yield Results
| Variety | Moisture | Adjusted Dry Yield |
| Wyffels W7696 | 19.4% | 268 |
| Wyffels W7956 | 19.8% | 268 |
| Stine 9808E-20 | 20.4% | 267 |
| NuTech 74B6AM | 18.4% | 266 |
| Wyffels W7876 | 18.6% | 265 |
| Wyffels W7888 | 19.3% | 262 |
| Pioneer P1185AM (check) | 18.0% | 261 |
| Pioneer P1108Q | 18.4% | 258 |
| Wyffels W7456 | 19.7% | 257 |
| Wyffels W7878 | 19.0% | 255 |
| Stine 9734-G | 19.0% | 252 |
| Stine 9746-20 | 18.3% | 246 |
| Stine R9734-32 | 20.2% | 244 |
I have not attempted to calculate a proper least significant difference for this data, but a quick and dirty technique I’ve heard is to calculate the standard deviation and use that as a stand in for the LSD. The standard deviation is 8.0 for both the adjusted dry yields in this table as well as the unadjusted dry yields of all harvested strips.
Trait Response
Two pairs of the varieties in this plot were the same underlying hybrid in different trait packages. We have not seen corn rootworm pressure in our area and wanted to test what response we’re seeing from the additional trait insertions.
| Roundup | Double Stack | Triple Stack | |
| Stine Hybrid | 9734-G | R9734-32 | |
| Wyffels Hybrid | W7876 | W7878 |
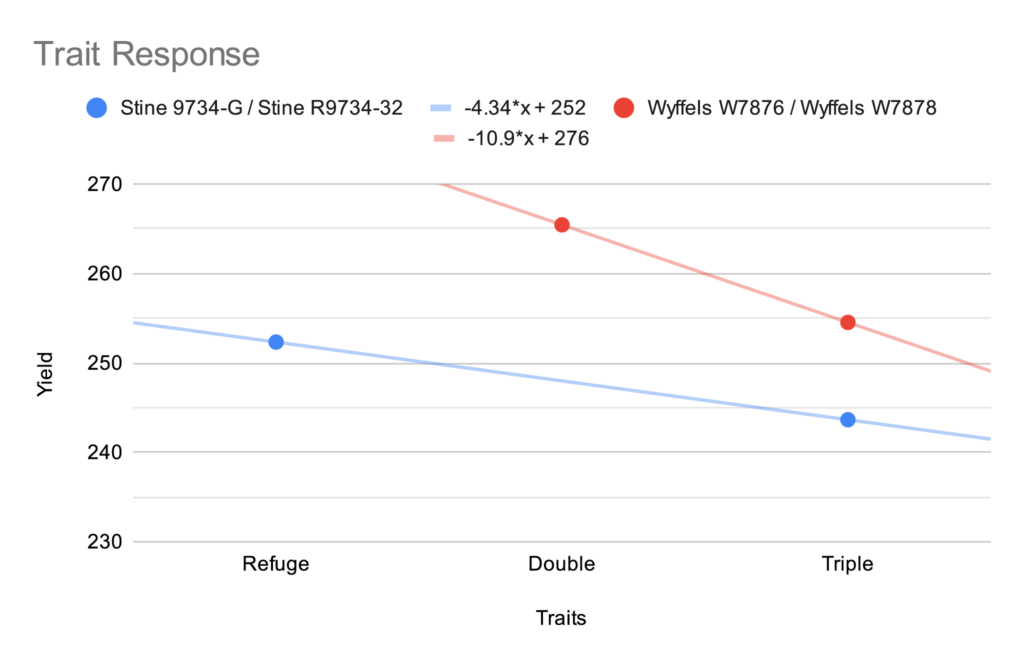
Given the absence of pest pressure, we saw a 5-10 bushel drag for each additional trait.
Seed Profitability Analysis
I’ve often seen people use a breakeven seed cost calculation that compares two varieties, usually starting from the perspective of cheaper variety A and asking (at a given market price) how many bushels it would take to pay for variety B. In this case we have 13 varieties (of which there would be 78 different pair combinations) and already know the yield performance difference in this plot. For this reason I prefer to calculate the seed on a cost per bushel basis which accounts for all the factors and can be ranked across the list without pairings.
Simply divide the seed cost per acre by the yield, right? Eh, this could be problematic. While this will technically give you cost per bushel, it hides the fact that all your other fixed costs will go up or down on a per bushel basis as the yield changes. This will tend to make cheaper, lower yielding varieties look artificially profitable. Imagine a thought experiment in which seed variety A costs $0.40 / acre and makes 1 bushel / acre. Seed variety B costs $115/acre and makes 230 bushels/acre. Variety A is technically $0.10 / bushel cheaper, yet in that scenario your other expenses would be hundreds of dollars per bushel.
For this reason, I account for all the other fixed costs and calculate a holistic breakeven bushel price.
((all non-seed expenses per acre) + (this variety's seed cost per acre)) / (this variety's yield)I used a non-seed expense of $700 which isn’t out of line with the University of Illinois’ 2021 crop budgets and is a nice round number.
| Variety | Total Cost per Bushel |
| Stine 9808E-20 | $2.91 |
| NuTech 74B6AM | $3.01 |
| Stine 9734-G | $3.03 |
| Wyffels W7696 | $3.04 |
| Wyffels W7956 | $3.06 |
| Wyffels W7876 | $3.11 |
| Pioneer P1185AM (check) | $3.16 |
| Wyffels W7456 | $3.17 |
| Stine 9746-20 | $3.19 |
| Wyffels W7888 | $3.20 |
| Stine R9734-32 | $3.28 |
| Pioneer P1108Q | $3.30 |
| Wyffels W7878 | $3.36 |
If there’s a flaw in my logic here or there’s a better way to rank seed profitability across many varieties, let me know. I’d be happy to adjust methodologies.
Fungicide Response
Ready to be disappointed?
If you’ve seen my article on manually logging a coverage map in John Deere Operations Center, you may recall how this field was partially sprayed with an aerial fungicide. Our goal was to have half of the plot sprayed and measure a fungicide response per variety across each plot row. How neat would that be?
Problem #1: “Half” Turned into “Fifth”
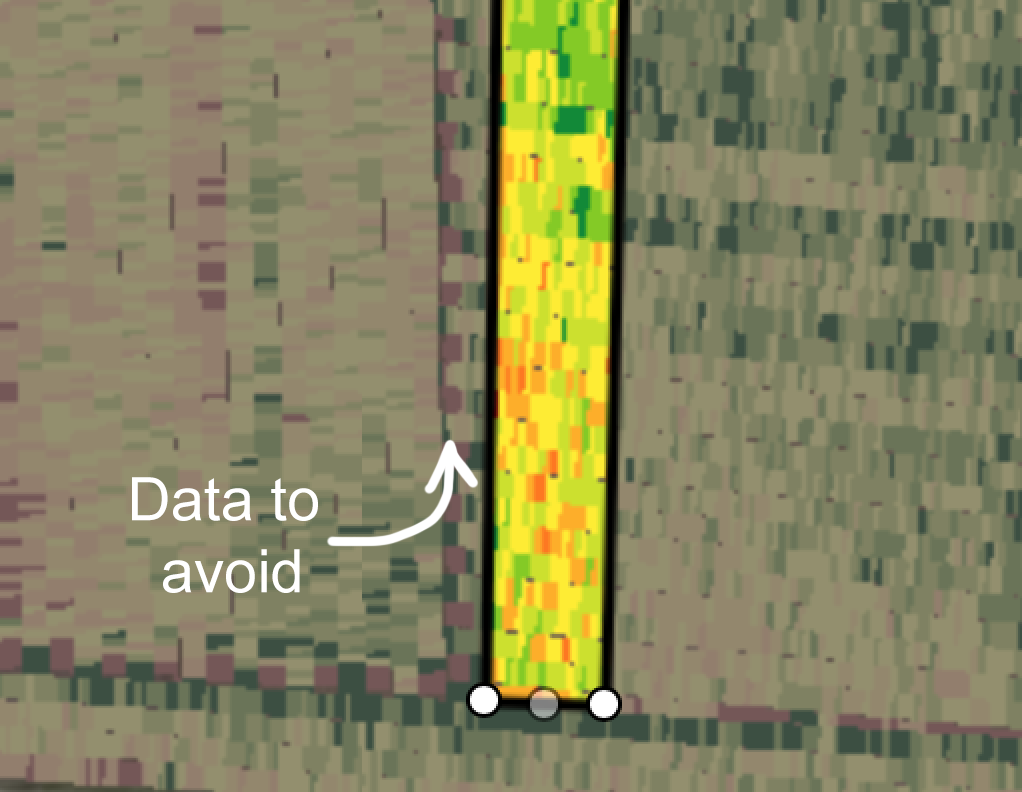
Our plot rows are 500′ long and the spray plane swath is 80′. Three swaths would have been a nice 240′, but four swaths were left unsprayed instead, so 320′ unsprayed, 180′ sprayed (in theory). Two factors whittle down that sprayed length even more; the plane bore slightly too far west, and I didn’t want to include the volatile yield map data right at the edge of the plot as the combine is entering/exiting a pass.
After also accounting for the slight angle mismatch of the eastmost swath, the usable sprayed area was about 90′ long.
Problem #2: Planes are Imprecise
Historical weather data shows the wind peaked at 10mph out of the west the day this was sprayed. From watching the mist fall patterns of spray planes, it’s very believable that a decent amount of eastward drift occured- but how far exactly? Even if you could calculate this drift, how sharp of an edge would you expect to see if measuring polygons?
Future Plans
I’d like to revisit this split fungicide treatment in the future and perhaps have it applied with a ground sprayer to have better precision over the application area.
I’d also like to continue to see how seed profitability comparisons fluctuate year to year. We had a very good growing season for corn this year, just a bit wet. It would be interesting to see how premium/cheaper varieties handle more adverse seasons.