
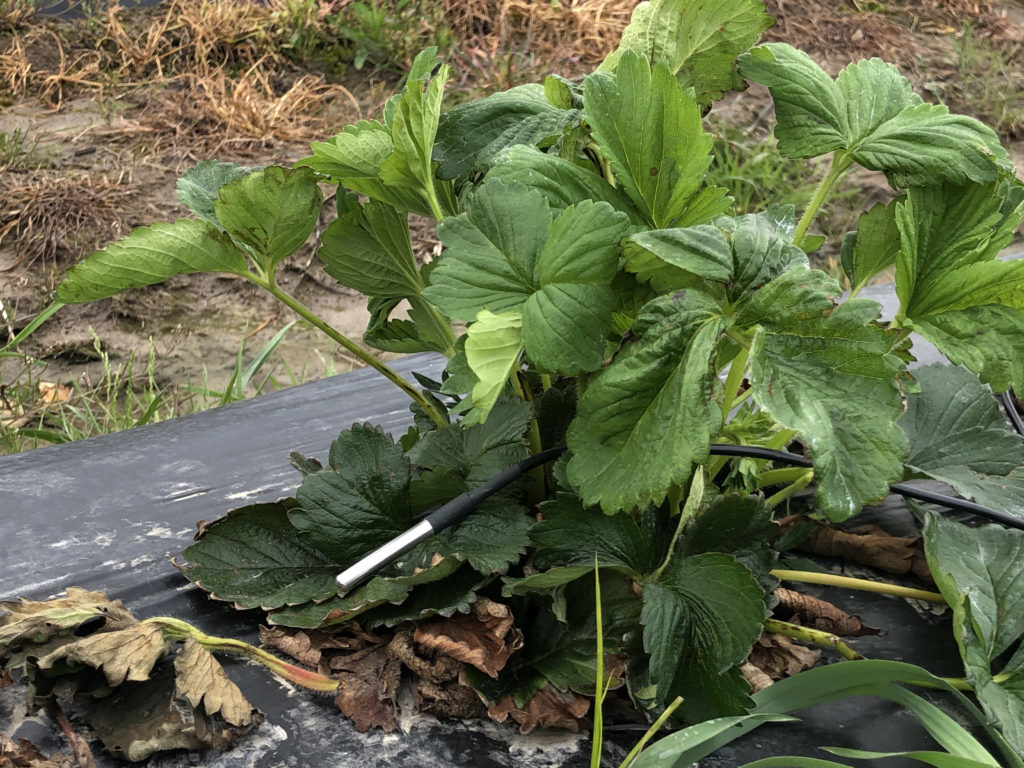
This project started while my wife and I were managing spring frost protection in our strawberry patch and trying to better understand how the temperature experienced at the bloom level compares to the air temperature reported by local weather stations on Weather Underground. In the year that has passed since building this temperature logger for that purpose, I’ve encountered several other scenarios where remotely monitoring a temperature can be really helpful:
- Air temperature in a well pump house during a cold snap
- Field soil temperature during planting season
- Air temperature in a high tunnel to guide venting decisions
Whatever you might use this for, the fundamentals are application agnostic and the microcontroller board from Particle used in this project can be connected to a wide array of sensors if you’d like to expand down the road. This tutorial lays out of the basics to get up and running with a single temperature probe.
Particle: Internet-Connected Arduino
If you’re not familiar, Arduino is an open source, single board microcontroller with numerous general purpose input/output (GPIO) pins that allow for easy interfacing between the physical world and code. It might seem rudimentary, but working at the physical/virtual boundary can be really satisfying; of course code can make an object on screen move, and of course touching a motor’s wiring to a battery can make it move, but the ability to use code to manipulate something in the physical world is a special kind of thrill. Absent expansion modules, an Arduino is a standalone board whose software is loaded via a USB cable and cannot natively publish data to the internet.
Particle essentially takes the Arduino hardware, adds a wifi (or cellular) internet connection, and marries it to their cloud software to create an easy to use, internet connected microcontroller. Not only does this make it easier to upload your code, but you can publish data back to the Particle Cloud, where it can trigger other web services.
Components
What you’ll need for this project:
- Particle development board
- I used a Photon, which is the older wifi-only board (now replaced by Argon). Particle has since added a free cellular plan for up to 100,000 device interactions per month (~135/hour), plenty for simple data logging. Unless you know you’ll always be near a wifi network, I’d now recommend a cellular-capable model like the Boron.
- Outdoor temperature sensor probe
- 4.7 kΩ resistor
- Breadboard
- External antenna (wifi or cellular, depending on your Particle hardware)
- I used these 2.4 GHz antennas for wifi on the Photon. The threaded base and nut make them easy to install through an enclosure wall.
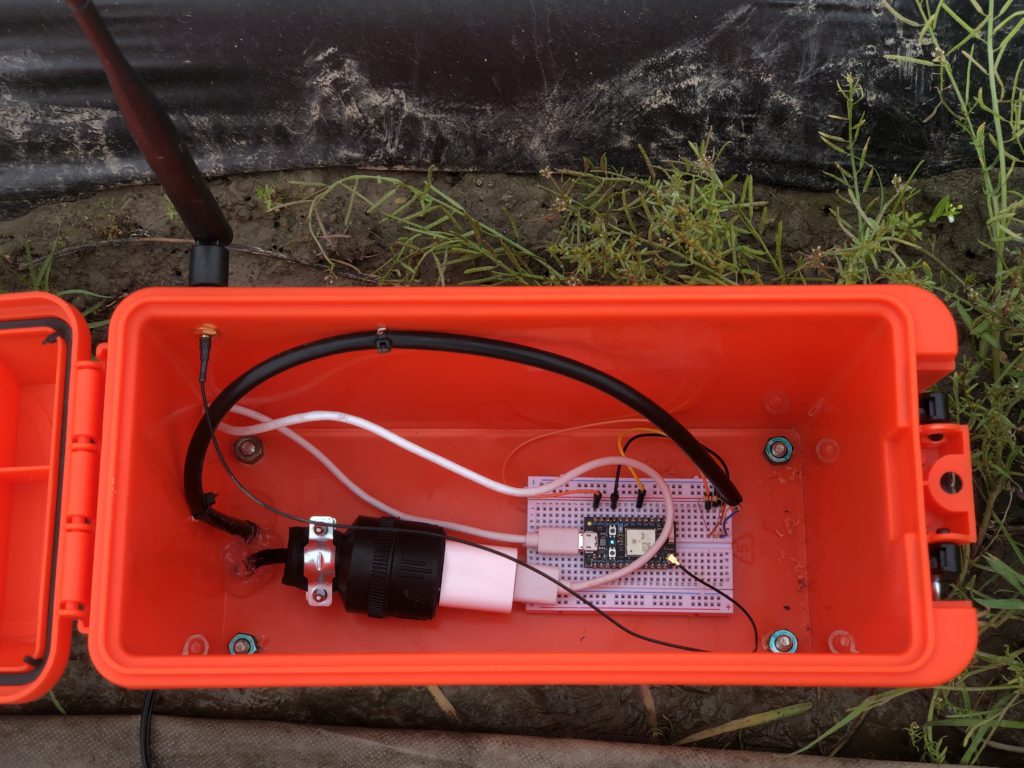
- Enclosure
- I used a plastic ammo case which worked well
- Power supply
- I used a USB charger block
Additional supplies to consider:
- A weather-resistant way to connect the power supply:
- I ran some lamp wire through a small hole in the bottom of the box, then added plugs to each end.
- Extension to the temperature probe wire
- I used Cat5 cable
- Do you need to keep the box upright and out of mud/water?
- I added some 4″ bolts as legs/stakes to secure the box upright and still ~2″ off the ground. This also allowed me to run the cables out of the bottom where they wouldn’t be subjected directly to rain
- Silicone/caulk to seal holes
Setup
Particle has a great Quickstart guide for each model of board, so I won’t reinvent the wheel explaining it here.
Also spend some time on Particle’s Hardware Examples page to acclimate yourself with the setup() and loop() structure of the code, how to read and write GPIO pins, the use of delays, etc.
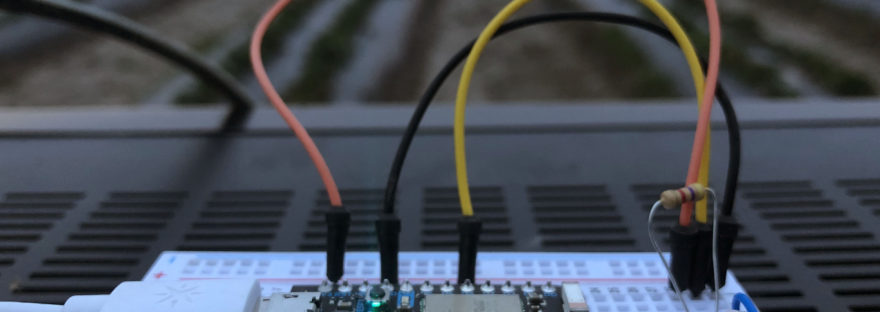
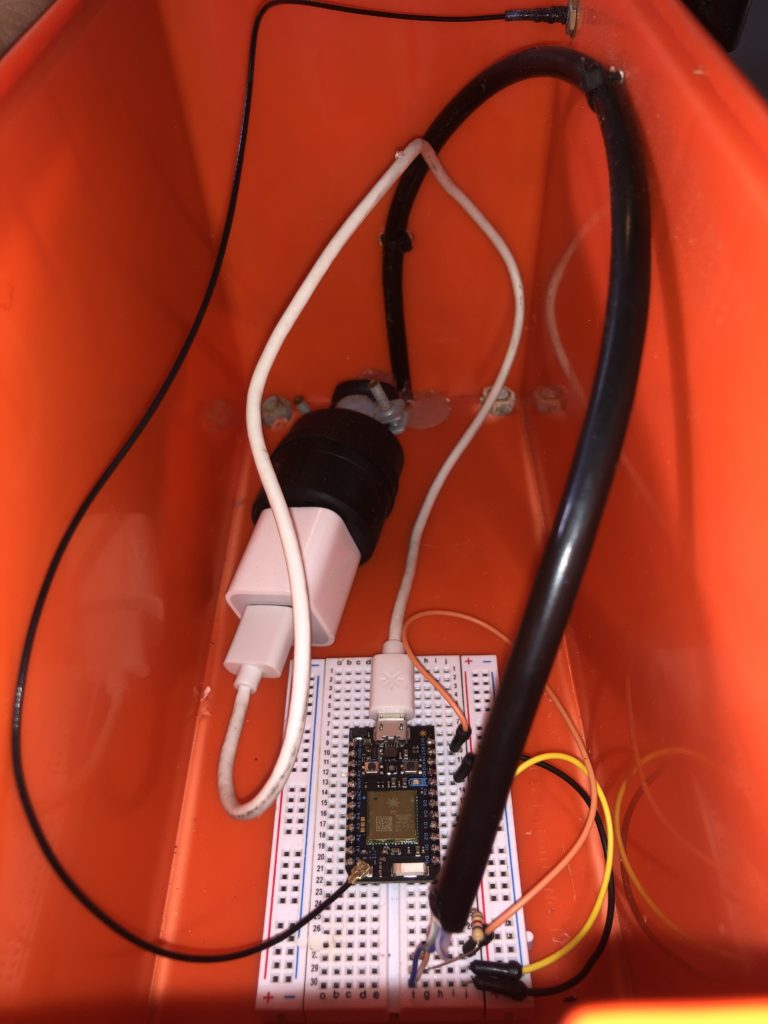
Hardware Configuration

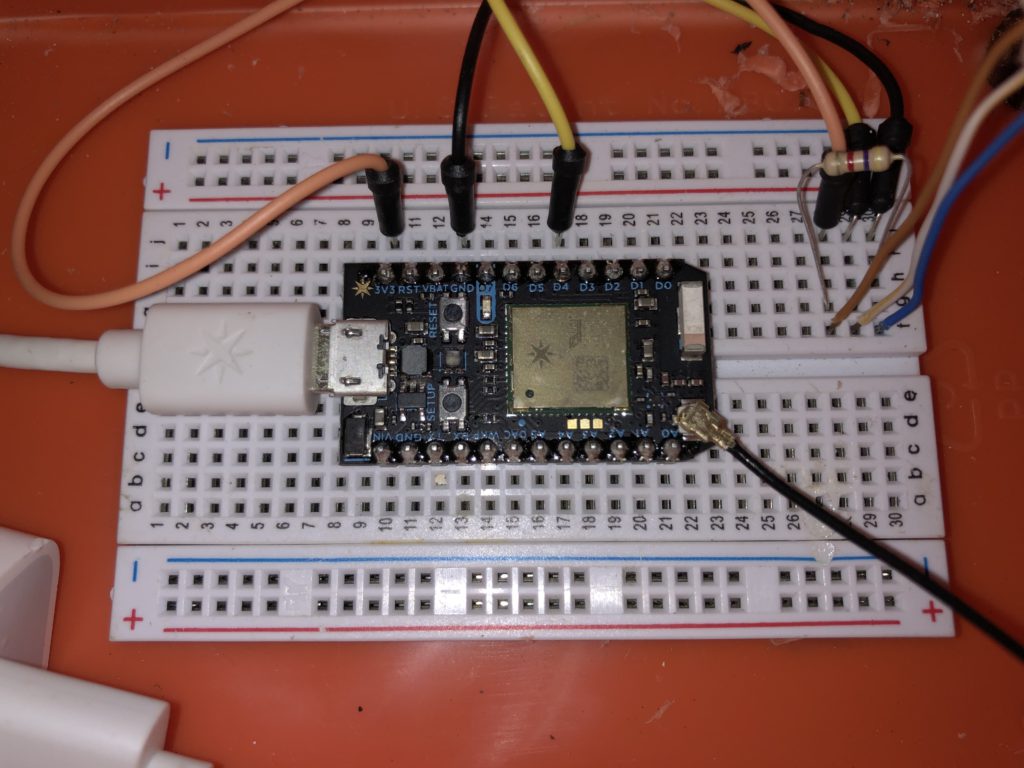
The black wire running out of the bottom right corner of the Particle board is the antenna.
As a practical matter, you’ll also want to consider how the probe wire is entering the box and how to provide strain relief to prevent it from (easily) pulling out of the breadboard. In my case, I made one large arc with the Cat5 cable which was anchored to the wall with several zip ties. I sealed these zip tie holes as well as the cable holes on the bottom with silicone.
Software Configuration
First, we’ll need to read the temperature from the probe and publish it to Particle’s cloud. Secondly, we’ll need to configure the Particle cloud to publish that data to a ThingSpeak dashboard for collection and graphing.
More buck-passing: I followed this tutorial from Particle, but I’ll list all my steps here as they diverge in the use of ThingSpeak.
Particle
The DS18B20 thermometer requires use of the 1-Wire protocol which is understood but the author in theory if not in practice. 1-Wire’s setup and error checking takes up the majority of the code.
Paste the following code into your Web IDE:
// This #include statement was automatically added by the Particle IDE.
#include <OneWire.h>


OneWire ds = OneWire(D4);  // 1-wire signal on pin D4

unsigned long lastUpdate = 0;

float lastTemp;

void setup() {
  Serial.begin(9600);

  pinMode(D7, OUTPUT);
}


void loop(void) {
  byte i;
  byte present = 0;
  byte type_s;
  byte data[12];
  byte addr[8];
  float celsius, fahrenheit;

  if ( !ds.search(addr)) {
    Serial.println("No more addresses.");
    Serial.println();
    ds.reset_search();
    delay(250);
    return;
  }

  // The order is changed a bit in this example
  // first the returned address is printed

  Serial.print("ROM =");
  for( i = 0; i < 8; i++) {
    Serial.write(' ');
    Serial.print(addr[i], HEX);
  }

  // second the CRC is checked, on fail,
  // print error and just return to try again

  if (OneWire::crc8(addr, 7) != addr[7]) {
      Serial.println("CRC is not valid!");
      return;
  }
  Serial.println();

  // we have a good address at this point
  // what kind of chip do we have?
  // we will set a type_s value for known types or just return

  // the first ROM byte indicates which chip
  switch (addr[0]) {
    case 0x10:
      Serial.println("  Chip = DS1820/DS18S20");
      type_s = 1;
      break;
    case 0x28:
      Serial.println("  Chip = DS18B20");
      type_s = 0;
      break;
    case 0x22:
      Serial.println("  Chip = DS1822");
      type_s = 0;
      break;
    case 0x26:
      Serial.println("  Chip = DS2438");
      type_s = 2;
      break;
    default:
      Serial.println("Unknown device type.");
      return;
  }

  // this device has temp so let's read it

  ds.reset();               // first clear the 1-wire bus
  ds.select(addr);          // now select the device we just found
  // ds.write(0x44, 1);     // tell it to start a conversion, with parasite power on at the end
  ds.write(0x44, 0);        // or start conversion in powered mode (bus finishes low)

  // just wait a second while the conversion takes place
  // different chips have different conversion times, check the specs, 1 sec is worse case + 250ms
  // you could also communicate with other devices if you like but you would need
  // to already know their address to select them.

  delay(1000);     // maybe 750ms is enough, maybe not, wait 1 sec for conversion

  // we might do a ds.depower() (parasite) here, but the reset will take care of it.

  // first make sure current values are in the scratch pad

  present = ds.reset();
  ds.select(addr);
  ds.write(0xB8,0);         // Recall Memory 0
  ds.write(0x00,0);         // Recall Memory 0

  // now read the scratch pad

  present = ds.reset();
  ds.select(addr);
  ds.write(0xBE,0);         // Read Scratchpad
  if (type_s == 2) {
    ds.write(0x00,0);       // The DS2438 needs a page# to read
  }

  // transfer and print the values

  Serial.print("  Data = ");
  Serial.print(present, HEX);
  Serial.print(" ");
  for ( i = 0; i < 9; i++) {           // we need 9 bytes
    data[i] = ds.read();
    Serial.print(data[i], HEX);
    Serial.print(" ");
  }
  Serial.print(" CRC=");
  Serial.print(OneWire::crc8(data, 8), HEX);
  Serial.println();

  // Convert the data to actual temperature
  // because the result is a 16 bit signed integer, it should
  // be stored to an "int16_t" type, which is always 16 bits
  // even when compiled on a 32 bit processor.
  int16_t raw = (data[1] << 8) | data[0];
  if (type_s == 2) raw = (data[2] << 8) | data[1];
  byte cfg = (data[4] & 0x60);

  switch (type_s) {
    case 1:
      raw = raw << 3; // 9 bit resolution default
      if (data[7] == 0x10) {
        // "count remain" gives full 12 bit resolution
        raw = (raw & 0xFFF0) + 12 - data[6];
      }
      celsius = (float)raw * 0.0625;
      break;
    case 0:
      // at lower res, the low bits are undefined, so let's zero them
      if (cfg == 0x00) raw = raw & ~7;  // 9 bit resolution, 93.75 ms
      if (cfg == 0x20) raw = raw & ~3; // 10 bit res, 187.5 ms
      if (cfg == 0x40) raw = raw & ~1; // 11 bit res, 375 ms
      // default is 12 bit resolution, 750 ms conversion time
      celsius = (float)raw * 0.0625;
      break;

    case 2:
      data[1] = (data[1] >> 3) & 0x1f;
      if (data[2] > 127) {
        celsius = (float)data[2] - ((float)data[1] * .03125);
      }else{
        celsius = (float)data[2] + ((float)data[1] * .03125);
      }
  }

  // remove random errors
  if((((celsius <= 0 && celsius > -1) && lastTemp > 5)) || celsius > 125) {
      celsius = lastTemp;
  }

  fahrenheit = celsius * 1.8 + 32.0;
  lastTemp = celsius;
  Serial.print("  Temperature = ");
  Serial.print(celsius);
  Serial.print(" Celsius, ");
  Serial.print(fahrenheit);
  Serial.println(" Fahrenheit");

  // now that we have the readings, we can publish them to the cloud
  String temperature = String(fahrenheit); // store temp in "temperature" string
  digitalWrite(D7, HIGH);
  Particle.publish("temperature", temperature, PRIVATE); // publish to cloud
  delay(100);
  digitalWrite(D7, LOW);
  delay((60*1000)-100); // 60 second delay
}
Several things to note:
- D4 is declared as the data pin in line 5.
- The first argument in Particle.publish() can be any string label you choose. This event name is what you’ll use in the Particle cloud to identify this piece of data.
- D7 on the Photon I’m using is the onboard LED. I set it to blink for at least 100 milliseconds each time a temperature is published. This helps in debugging, as you can verify by watching the device if there is a temperature reading being taken.
- I’m publishing a temperature every 60 seconds. The delay function takes in milliseconds, hence the 60 * 1000. To be petty, I subtract 100 milliseconds from the delay total to account for the 100 milliseconds of D7 illumination I added above.
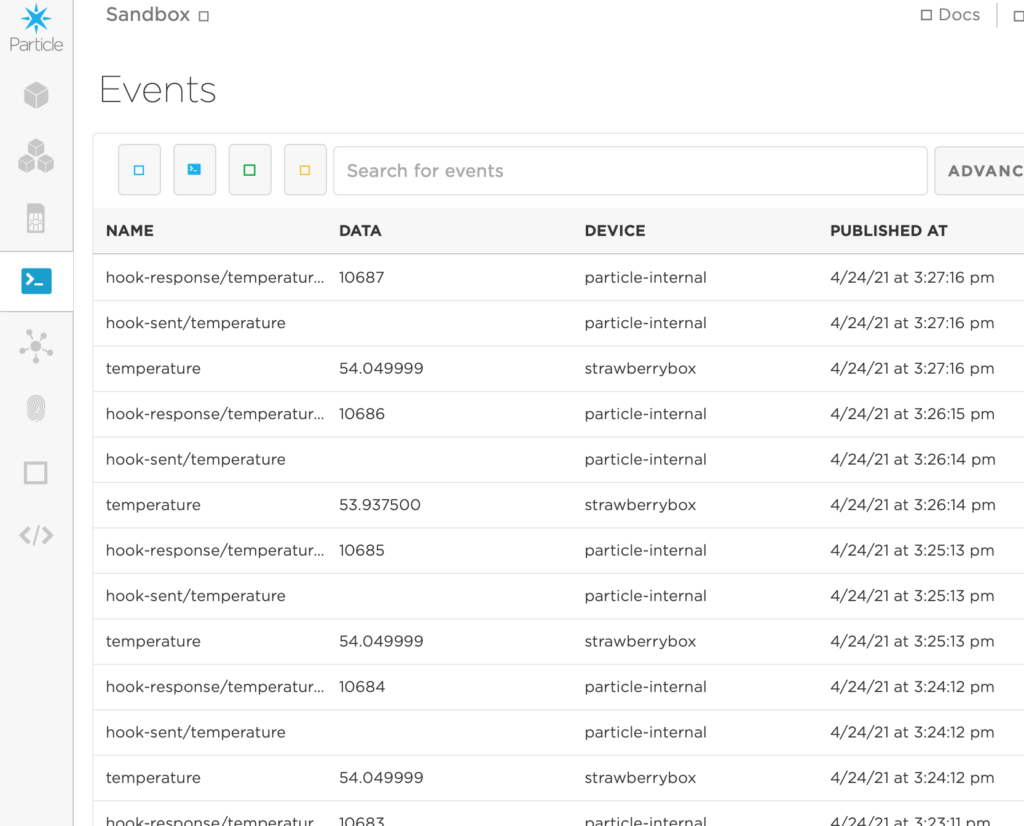
Once you flash the above code to your Particle device, navigate to the Events tab in the Particle console. You should start seeing data published at whatever interval and name you configured.
Software- ThinkSpeak
Once the data is publishing to Particle’s cloud, you can go many places with it. I chose to use ThinkSpeak so I could easily view the current temperature from a browser and see a simple historical graph.
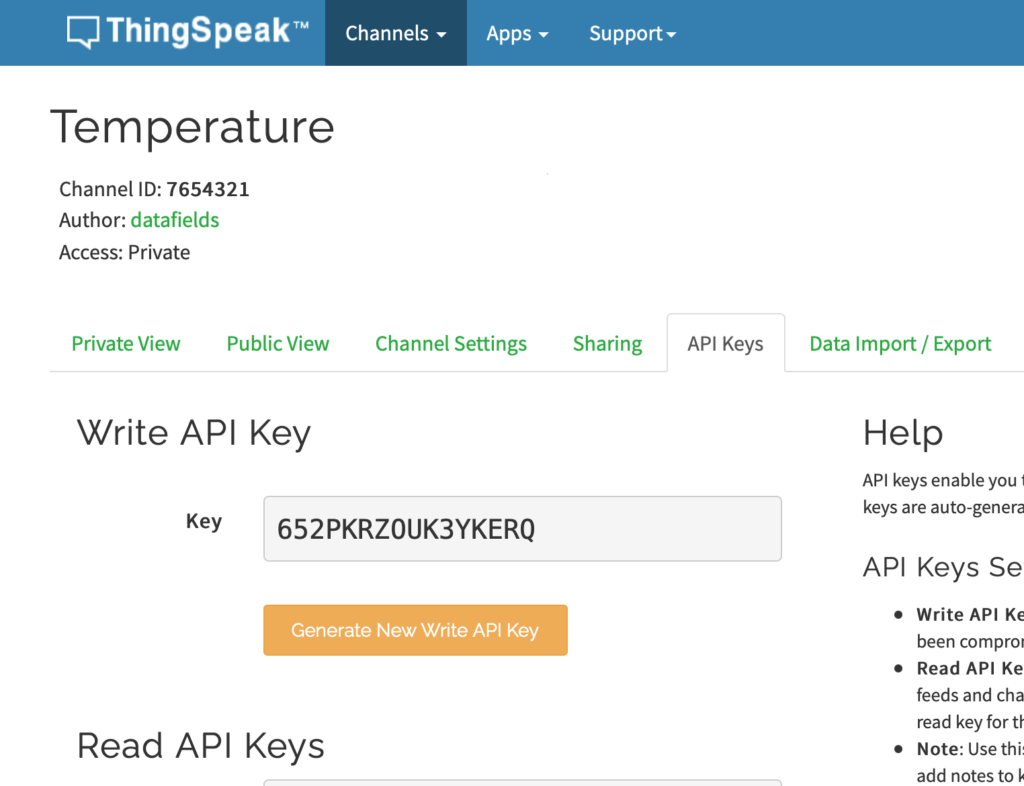
Set up a free ThinkSpeak account at thingspeak.com
Create a new Channel and label Field 1 as temperature
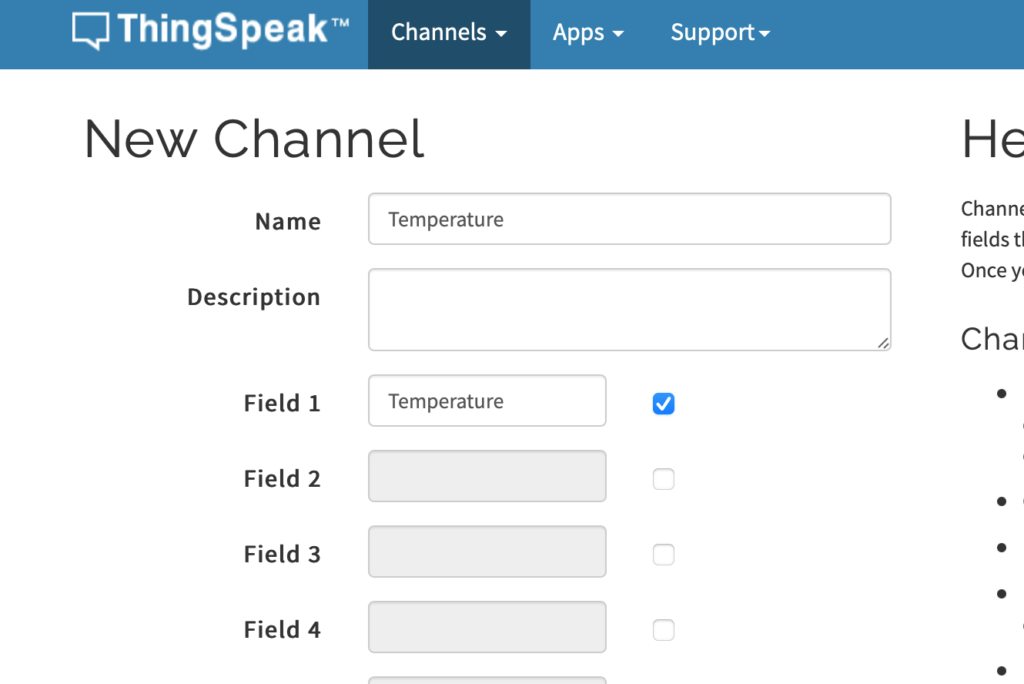
After creating the channel, click on API Keys. Make note of the Channel ID and Write API Key.
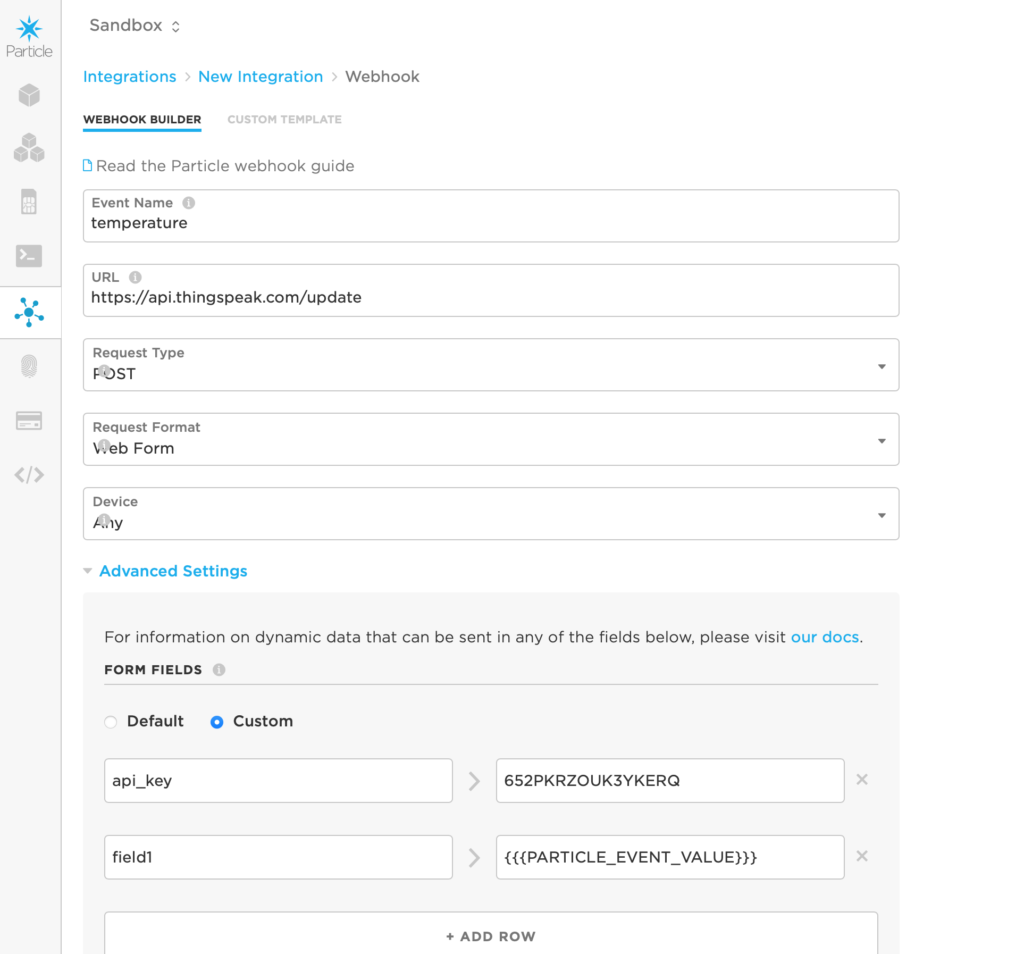
Back at the Particle Console, click on the Integrations tab.
Click New Integration, and select Webhook.
Webhook fields:
- Event Name: the event name to trigger this web hook- whatever you set as the first argument in the Particle.publish() function
- URL: https://api.thingspeak.com/update
- Request Type: POST
- Request Format: Web Form
- Device: can be left to Any, unless you only want specific devices in your cloud to trigger this webhook
Click on Advanced settings, and under Form Fields, select Custom.
Add the following pairs:
- api_key > your api key
- field1 > {{{PARTICLE_EVENT_VALUE}}}
Save this and navigate back to ThingSpeak. You should start seeing data publishing to your channel.
ThingSpeak Data Display Options
A ThingSpeak channel can be populated with Visualizations and Widgets which can be added with the corresponding buttons at the top of the channel. A widget is a simple indicator of the last known data value, while visualizations allow for historical data, *ahem*, visualization. You can also create your own MatLab visualizations if you want to do more sophisticated analysis or charting.
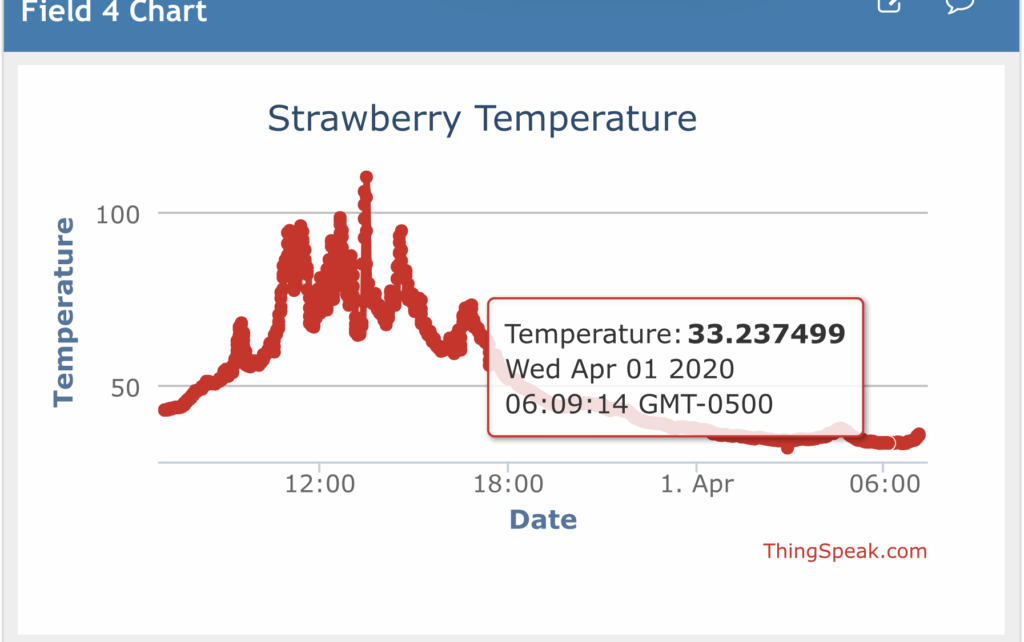
Chart Visualization
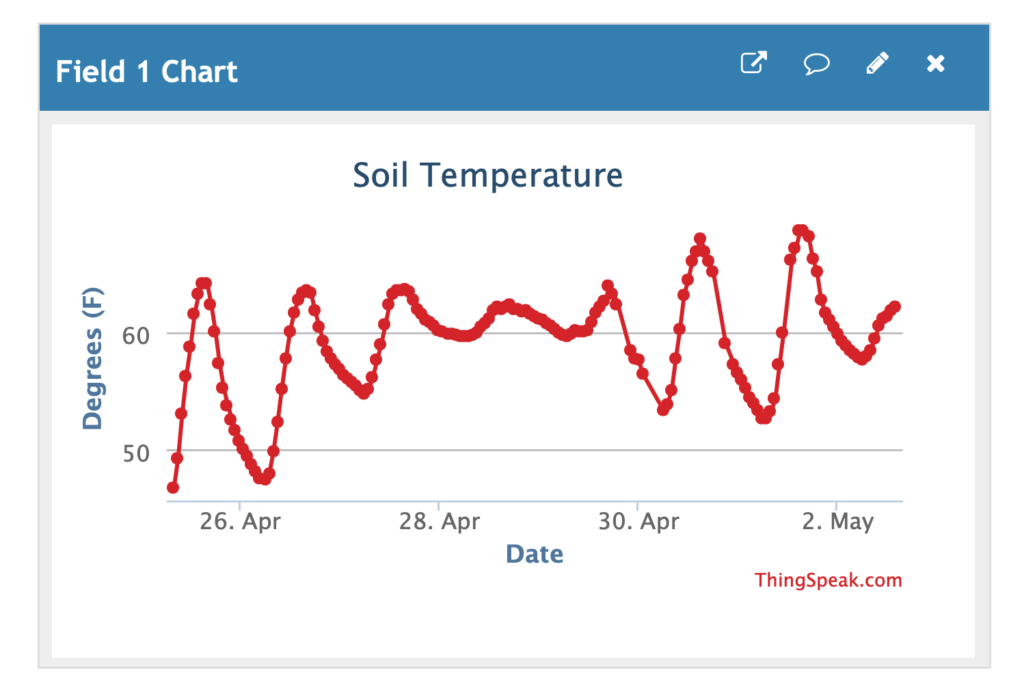
The Field 1 Chart should be added to channel automatically- if not, click Add Visualization and choose the Field 1 Chart. This visualization can be customized by clicking the pencil icon in the upper right corner and has a lot of configurable options:
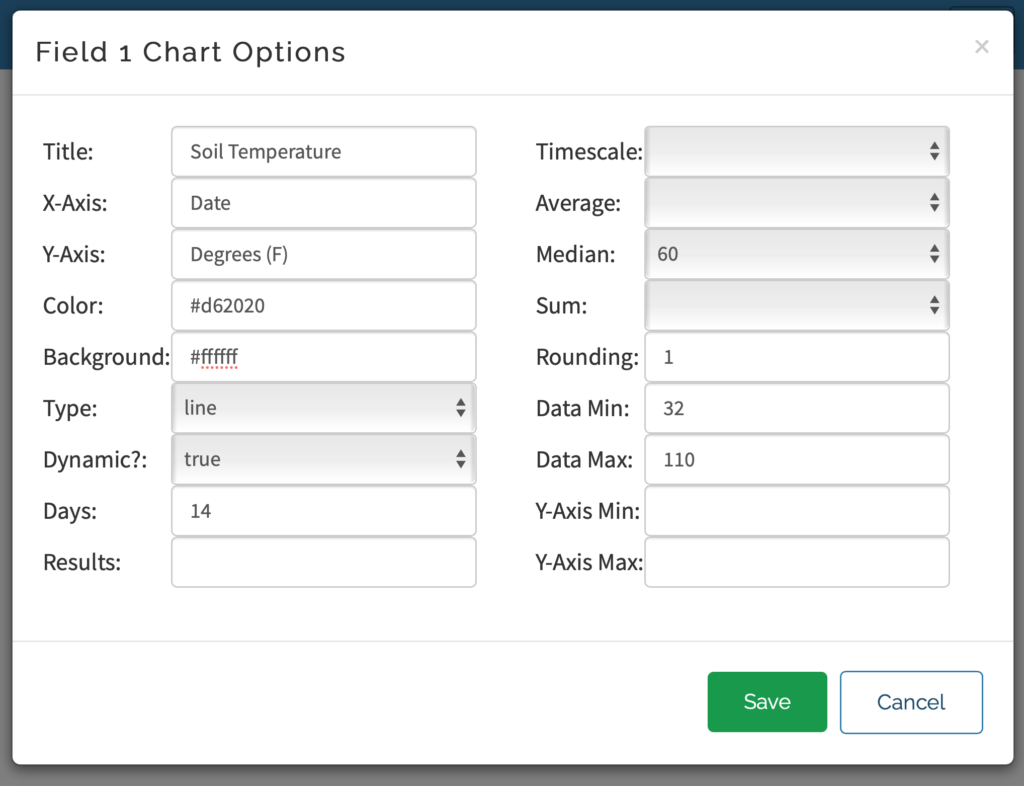
- Title: chart title that appears directly above graph (there’s no way to change the “Field 1 Chart” in the blue bar)
- X-Axis: text label for x axis
- Y-Axis: text label for y axis
- Color: hex color code for chart line/points
- Background: hex color code for chart background
- Type: choice between:
- Line (shown in my example)
- Bar
- Column
- Spline
- Step
- Not sure what Spline and Step do as they look the same as the Line graph, so you’ll have to play around and see what you prefer
- Dynamic: not sure what this does, I see no effect when toggling
- Days: how many days of historical data to show (seems to be capped at 7 days regardless of larger values being entered)
- Results: limit the chart to a certain number of data points. If you collect data once a minute, limiting to 60 results would give you one hour of data. Leave this field blank to not apply result limit.
- Timescale / Average / Median / Sum:
- These are mutually exclusive ways of aggregating the data together into fewer graph points. Timescale and Average seem to be the same, so effectively you’re choosing between the average, median, and sum of every X number of points. This simplifies the graph compared to showing 7 days worth of minutely data.
- I like to use Median with 60 points to get a median hourly data. I chose median because occasionally for unknown reasons, the Particle will report of temperatures of several thousand degrees which is obviously an error. When using average I would see spikes on any hours with such an error, whereas median eliminates that pull.
- Rounding: number of decimal places to display when clicking on a point
- Data Min: The minimum value that should be included in the data set. Any data points lower than this won’t be attempted to be graphed. This also helps with the bizarre temperature error I mentioned above, so I often set this to temperature ranges safely at the far edges of what would be normal for my application
- Data Max: Opposite of data min, sets an upper bound for included data
- Y-Axis Min: Impacts the visual rendering of the y axis. Leave blank to automatically adjust the axis according to the data being graphed.
- Y-Axis Max: Opposite of Y-Axis Min, sets upper bound for y-axis rendering
Numeric Display Widget
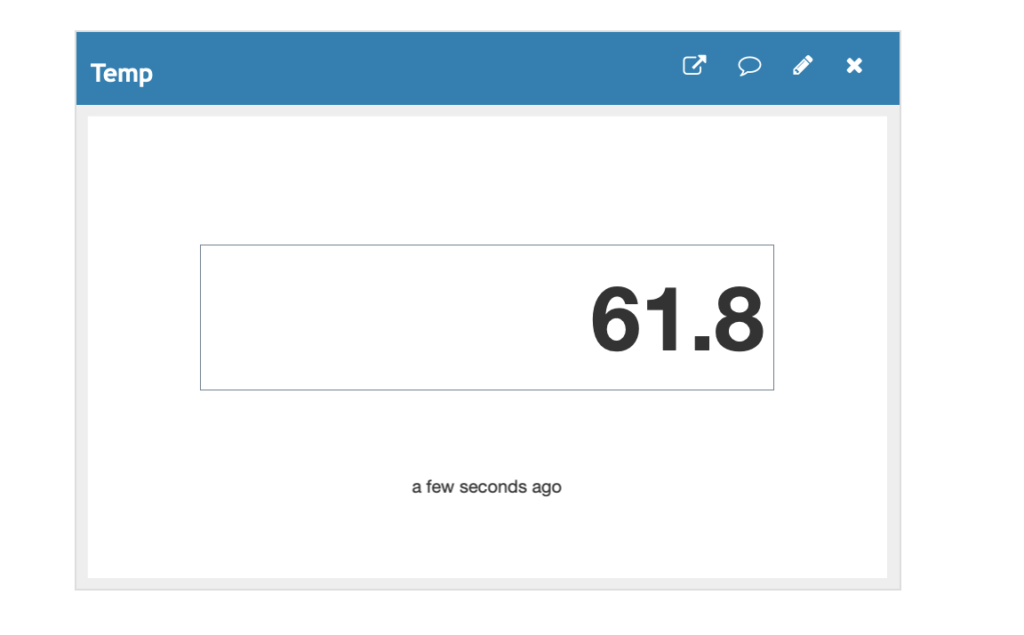
The numeric display will simply show the last recorded value as well as an indicator for how old that data is. I made this the first widget on the channel so I can see right away what the “current” value is.
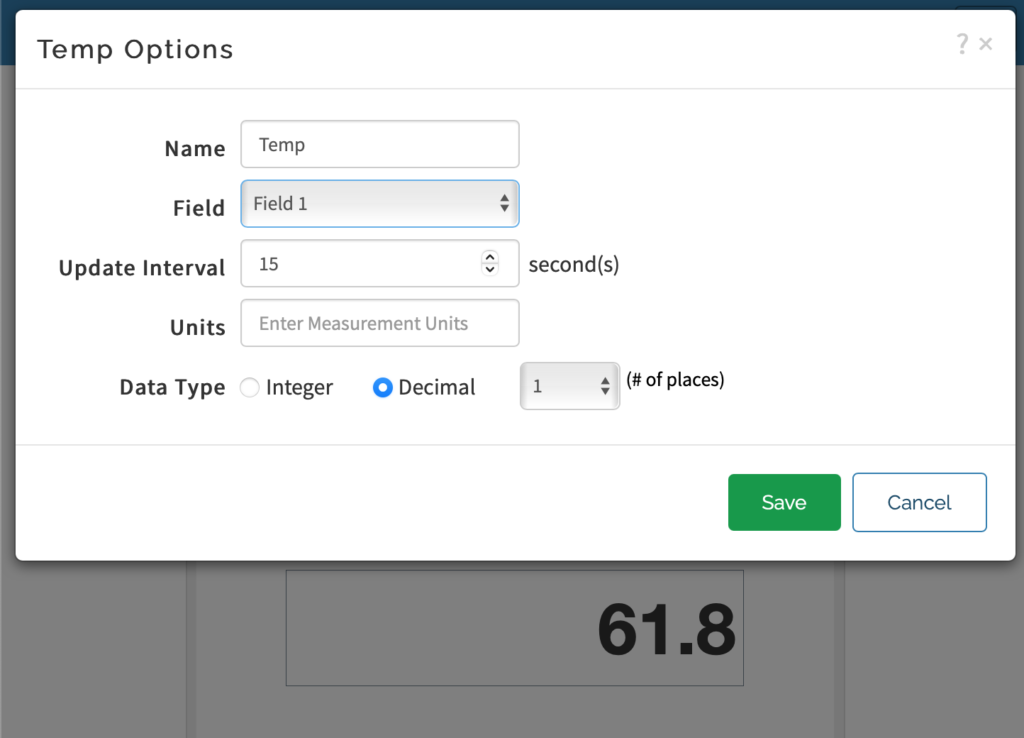
This widget has several configurable options, like the name that will appear in the blue title bar, which field is being displayed, and how often the widget should refresh with new data. I set this to 15 seconds which is plenty often for data that should only change every 60 seconds. You can also round to a certain number of decimal places.
Gauge Widget
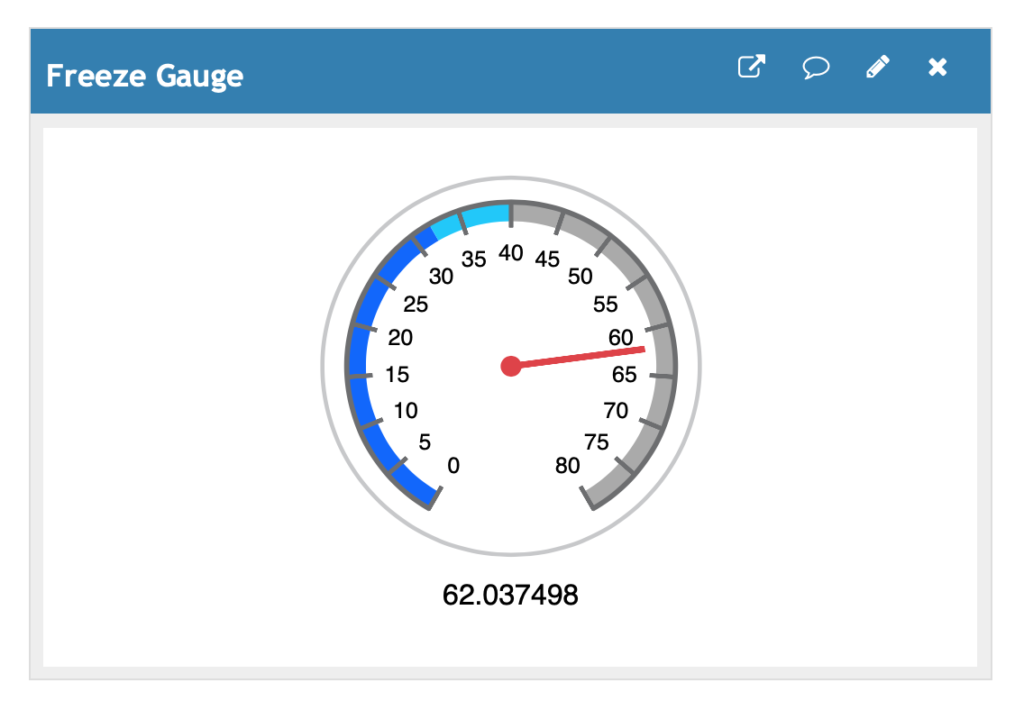
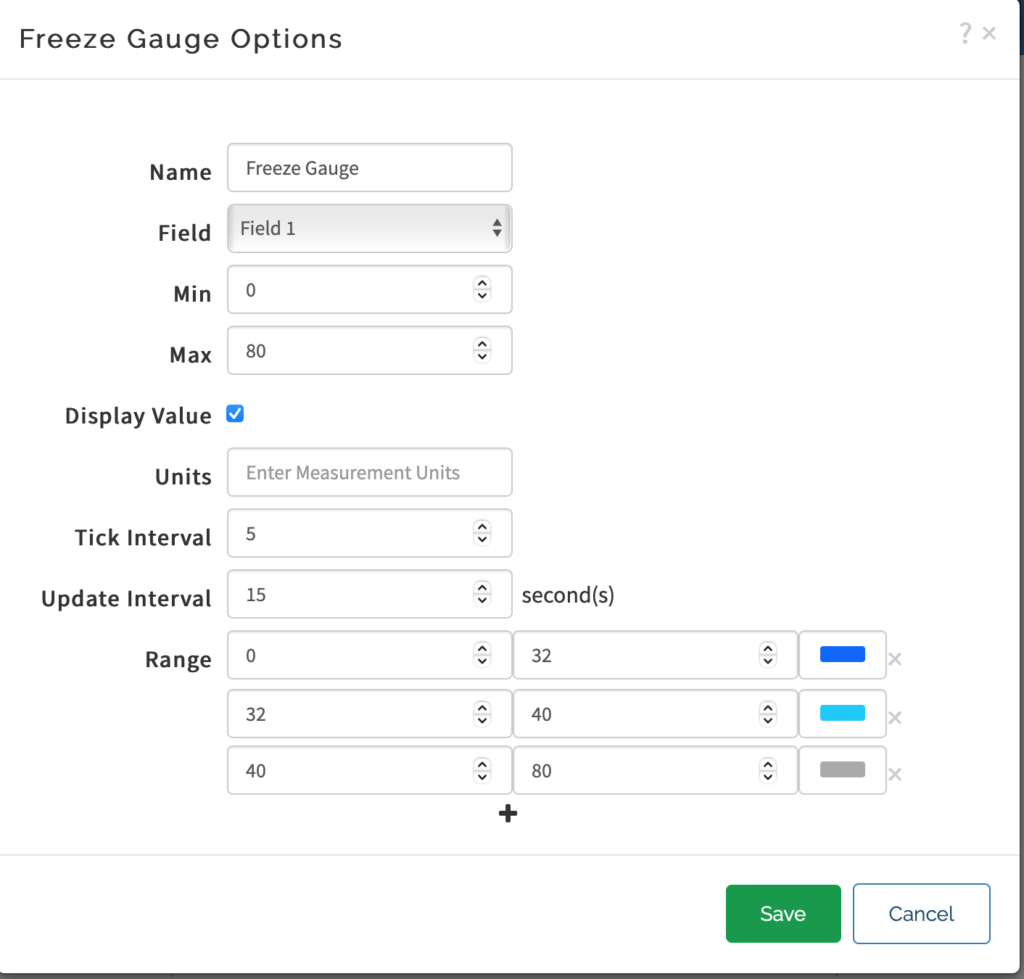
The gauge widget adds some visual context for the data and allows you to customize numerical ranges and colors associated with ranges. Here’s an example of a gauge with color ranges for freezing or near freezing temperatures.
Configurable options for this include the widget title, minimum and maximum gauge range, and start/stop values for color bands.
Lamp Widget
This is the most limited display type, but I guess its cute. It allows you to turn on or off a virtual light bulb above/below a given threshold. The logic is very similar to the gauge but simpler, so I won’t spend time re-explaining the functionality.
Adding Additional Sensors
Every step in this data pipeline (the Particle hardware, the Particle Cloud, and ThingSpeak’s channels) are ready to accept multiple pieces of data if you want to add more sensors to the box.
It’s easy to imagine some of the additional data that could be added to the board and collected.
- Humidity
- Soil moisture
- Multiple temperature probes (the 1Wire library used by the probes in this tutorial allow for this to happen over the same pin)
- Motion detection
- Liquid flow meter
In the future, I’d like to buy a Boron board with cellular connectivity and make a standalone box with a solar panel and battery that could be flexibly placed anywhere. I’m also interested in the idea of wiring up the board to a handful of plugs through the side of the box and being able to easily add and remove sensors based on the need of the use. I’ll keep you posted if I do this.
If you have any use case ideas or want to share your own project or implementation, please leave a comment or get in touch!