

Early in 2020, I was facing my first year of managing my own acreage and subsequently marketing the grain (what a roller coaster I was in for) so I became a sponge for any advice I could find. I spent some time reading through Nick Horob’s thoughts on the Harvest Profit blog and I joined the Grain Market Discussion Facebook group. One theme I repeatedly encountered was the importance of separating the futures and the basis portion of a sale. This was enabled by “understanding your local historical basis patterns”. I had no clue what was typical in our area, so I jumped on the challenge of obtaining a data set to assist in this.
Over a year later this is still a work in progress, but I’ll report what I’ve learned thus far in my quest to quantify the local basis market.
Free Data Sources
USDA Data
The USDA’s Ag Marketing Service has basis data available via this query tool for the following locations:
- Augusta, AR
- Blytheville, AR
- DeWitt, AR
- Dermott, AR
- Des Arc, AR
- Helena, AR
- Jonesboro, AR
- Little Rock, AR
- Old Town/Elaine, AR
- Osceola, AR
- Pendleton, AR
- Pine Bluff, AR
- Stuttgart, AR
- West Memphis, AR
- Wheatley, AR
- Wynne, AR
- East Iowa, IA
- Iowa, IA
- Mississippi River Northern Iowa, IA
- Mississippi River Southern Iowa, IA
- Mississippi River Southern Minn., IA
- North East Iowa, IA
- North West Iowa, IA
- Southern Minnesota, IA
- West Iowa, IA
- Central Illinois, IL
- Illinois River North of Peoria, IL
- Illinois River South of Peoria, IL
- Central Kansas, KS
- Western Kansas, KS
- Louisiana Gulf, LA
- Duluth, MN
- Minneapolis, MN
- Minneapolis – Duluth, MN
- Minnesota, MN
- Kansas City, MO
- Nebraska, NE
- Portland, OR
- Memphis, TN
Technically, this data does allow for future basis as the Delivery Period column contains a few rows for “New Crop”, but most of the data I’ve seen from this is “Cash” (spot price), so it won’t provide a sense of how the basis changes as the delivery period approaches. The geographic coverage is also hit or miss- congrats to everyone who lives in Arkansas; those of us in the large and ambiguous area of “Central Illinois” envy your data granularity.
Bottom line: if you farm near an unambiguous location and just need a continuous chart, this would be a good data source for you.
University of Illinois Regional Data
One of the first resources I came across were these regional datasets (corn, soybeans) from the University of Illinois which go back to the 1970s. This is tracked across 7 regions in Illinois and does a slightly better job of getting closer to your local market:
- Northern
- Western
- N. Central
- S. Central
- Wabash
- W.S. West
- L. Egypt
Unlike the continuous spot data from the USDA, this data tracks 3 futures delivery periods (December, March, July) starting in January of the production year. This provides as much as ~80 weeks of July basis futures, for example.
This regional data is likely to be more smoothed out than what you’d see at any specific elevator, so it’s challenging to make very qualitative decisions with it directly. I’ve attempted to calibrate this data to my local market using regression analysis and haven’t been that comforted with the accuracy of the results. I’d only recommend this dataset as a way of generalizing the shape of the seasonal trend without looking at the actual numeric levels.
Bottom line: this data shows how basis changes as delivery approaches in several contract months, but is limited to Illinois and the regional average isn’t likely precise to your local elevators.
Purdue University Crop Basis Tool
For those looking for similar regional data not limited to Illinois, this web-based dashboard from Purdue University offers similar data for Indiana, Ohio, Michigan, and Illinois. This is also very user friendly and allows you to dig into the data from a web browser without the need for opening a spreadsheet.
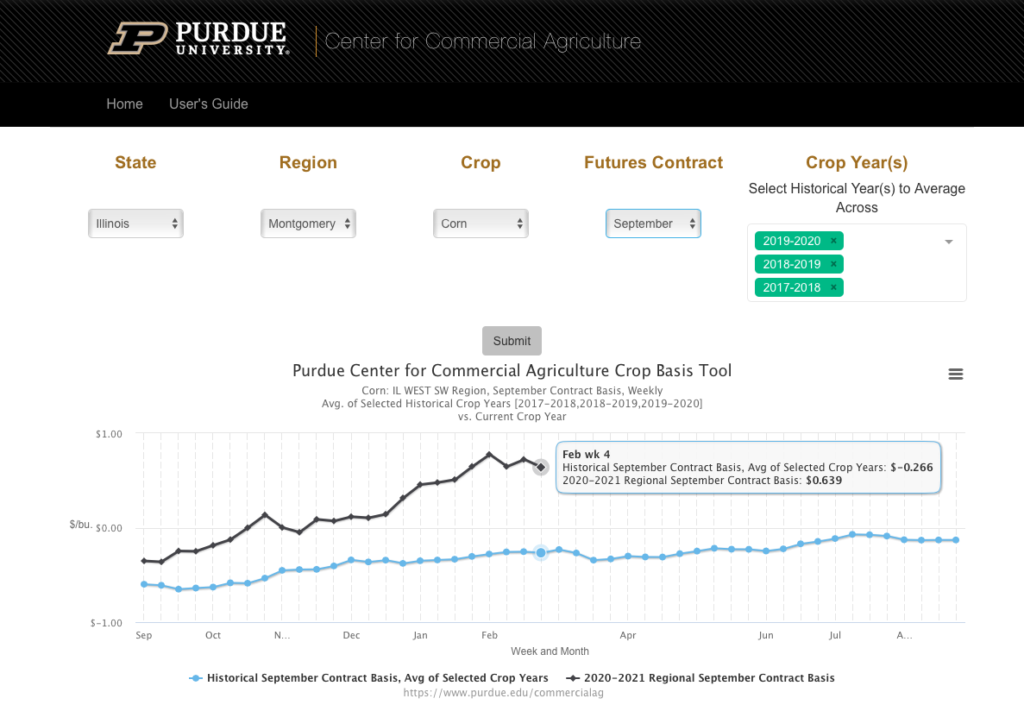
I did a bit of spot checking and found the values for my county to be way off, so I think that falls into the same issues as the U of I data in terms of regional smoothing and an offset. It’s also easy to have a false expectation of precision given that you select your county but it just does a lookup for the appropriate region.
Bottom line: this is most user-friendly free tool I’ve found for viewing basis data and comparing to historical averages, but is limited to 4 states and is still regionally averaged so won’t match values at your local elevators.
DIY Data Collection
What’s the surefire way to get 5 years of data on anything? Start collecting it today, and you’ll have it in 5 years. This is the slow-go approach but one I’ve seen repeated by other farmers who track basis- I’ve asked around thinking somebody has some great off the shelf dataset, and often you’ll find people just check prices weekly and dump it in a spreadsheet.
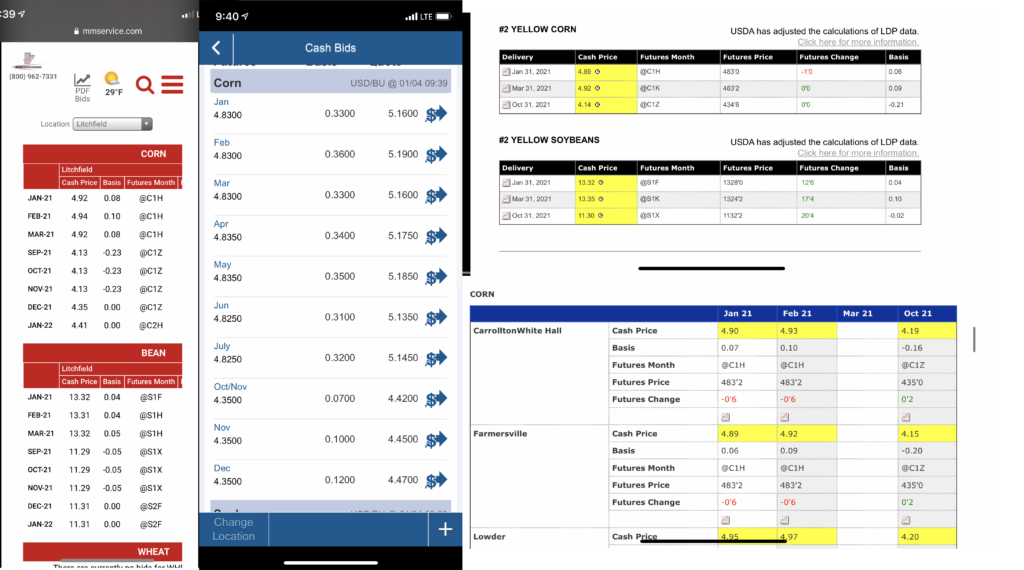
My process is to take phone screenshots of cash bids twice a week (I chose Monday and Thursday). This is a very fast and easy way of capturing the data that I can keep up with even in the busy season. I then go through these screenshots when I have time each week or so and type the data into a spreadsheet. This only takes me about 10 minutes a week to populate since the contract months and locations don’t change that frequently and can be copied and pasted from the previous entry.
Another route you could go (depending on your elevators’ participation) is to sign up for email cash bids. In my case, not everywhere I wanted to track offered this, so if I was going to screenshot one, I might as well do that for my whole process. (If you go that route, you may want to set up a different email inbox and a forwarding rule to save yourself the spamming.)
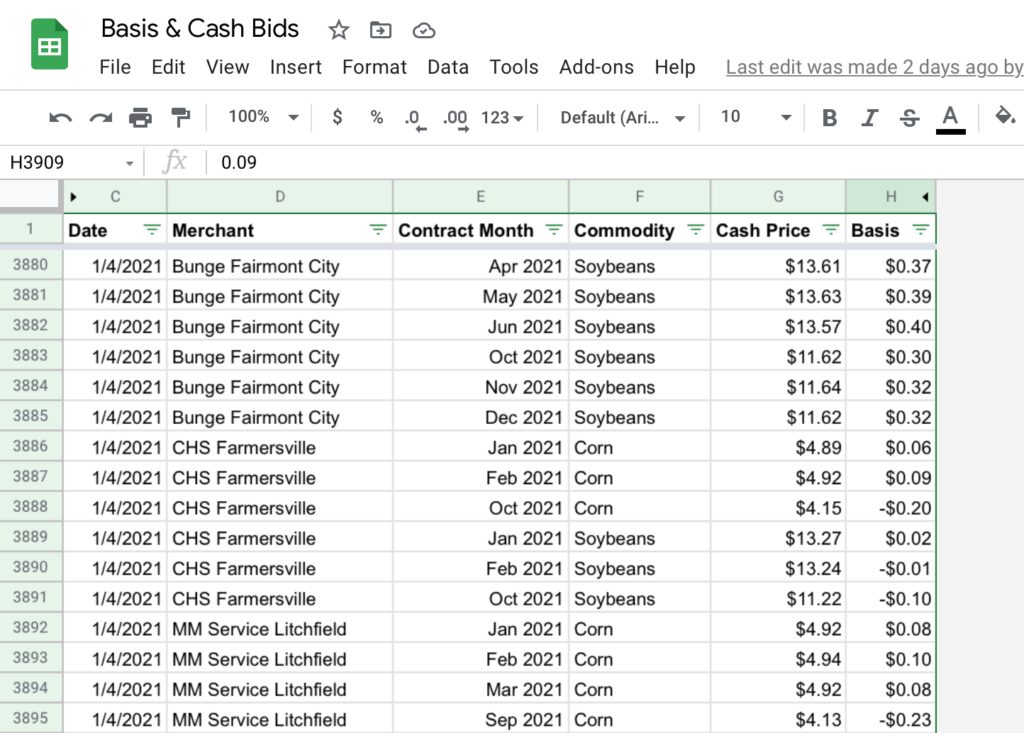
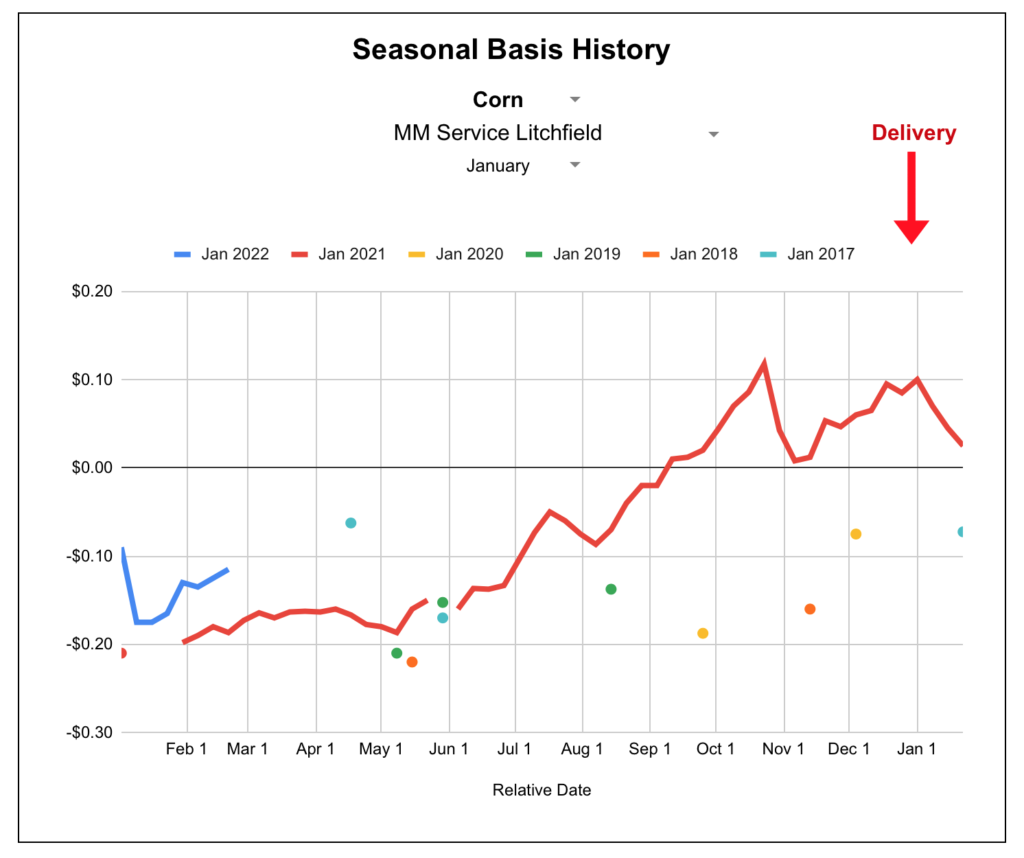
Based on this normalized data, I set up a few pages with pivot tables and charts. My primary goal is to understand when to make cash sales vs HTAs, and when to then set the basis on those HTA; that’s what I hope to visualize with this main chart below.
You’ll also notice a few points from past years- I dug out old cash sale records for our farm and backed into the basis by looking up the board price for that day on these historical futures charts. It wasn’t documented what time of day the sale was made so there could be some slippage, but I excluded any days where there was a lot of market volatility figuring that it would be better to have less data than wrong data.
I also created this page to chart basis spreads between any two locations, in this case frequently viewed between a local elevator and a river terminal.
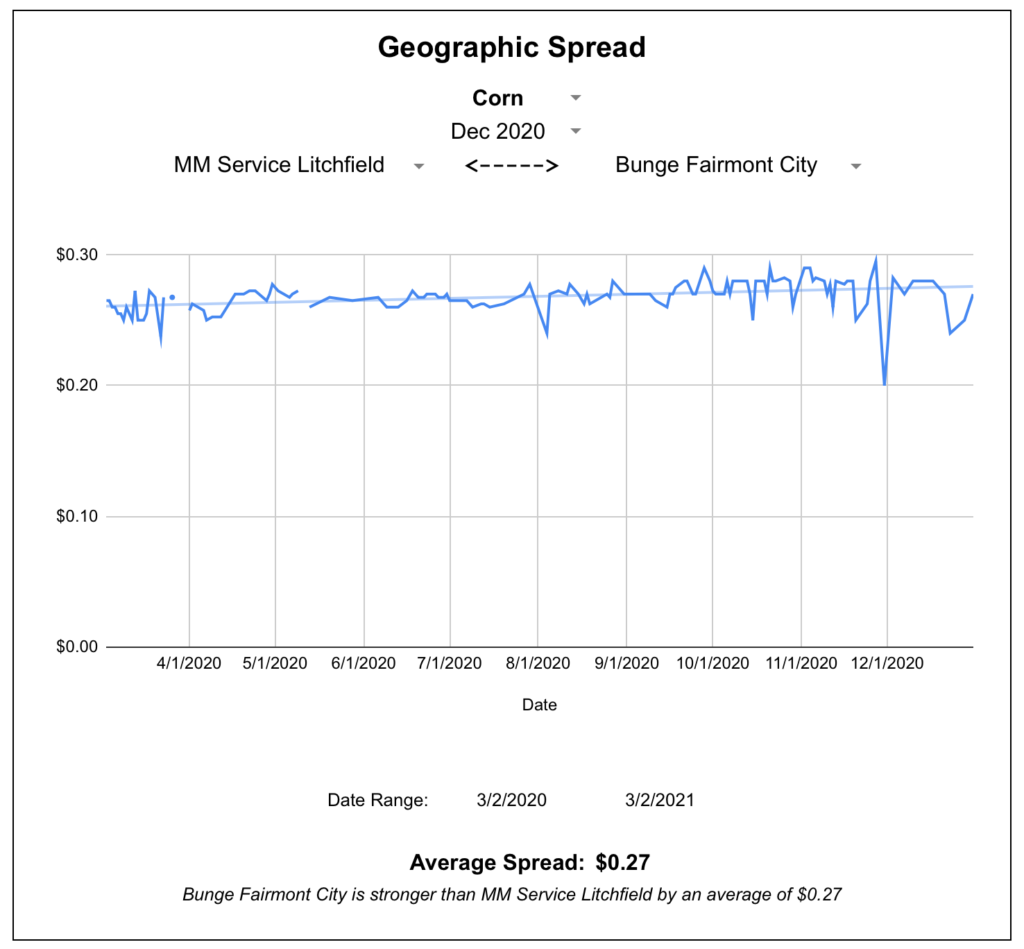
The great thing about having your own data is the flexibility to query it however you want. I’m sure as needs change I’ll make different types of reports and queries that answer questions I have yet to ask.
Here’s a link to a blank copy of my Google Sheet for you to use and branch off of as you wish. Things might look funky at first without data, but once you populate the Raw Data sheet a bit all the queries and dropdown should work.
Bottom line: You won’t see quick results, but collecting your own basis data is free, not that hard to do, and ensures the data is precise to your area. It’s also the ultimate insurance policy against changes in the availability of an outside data set.
Paid Data Sources
GeoGrain- Dashboard Subscription
GeoGrain is a paid subscription dashboard that tracks cash bids and basis levels at an elevator-specific level. I found most of the elevators in my area listed there and had decent luck viewing historical data.
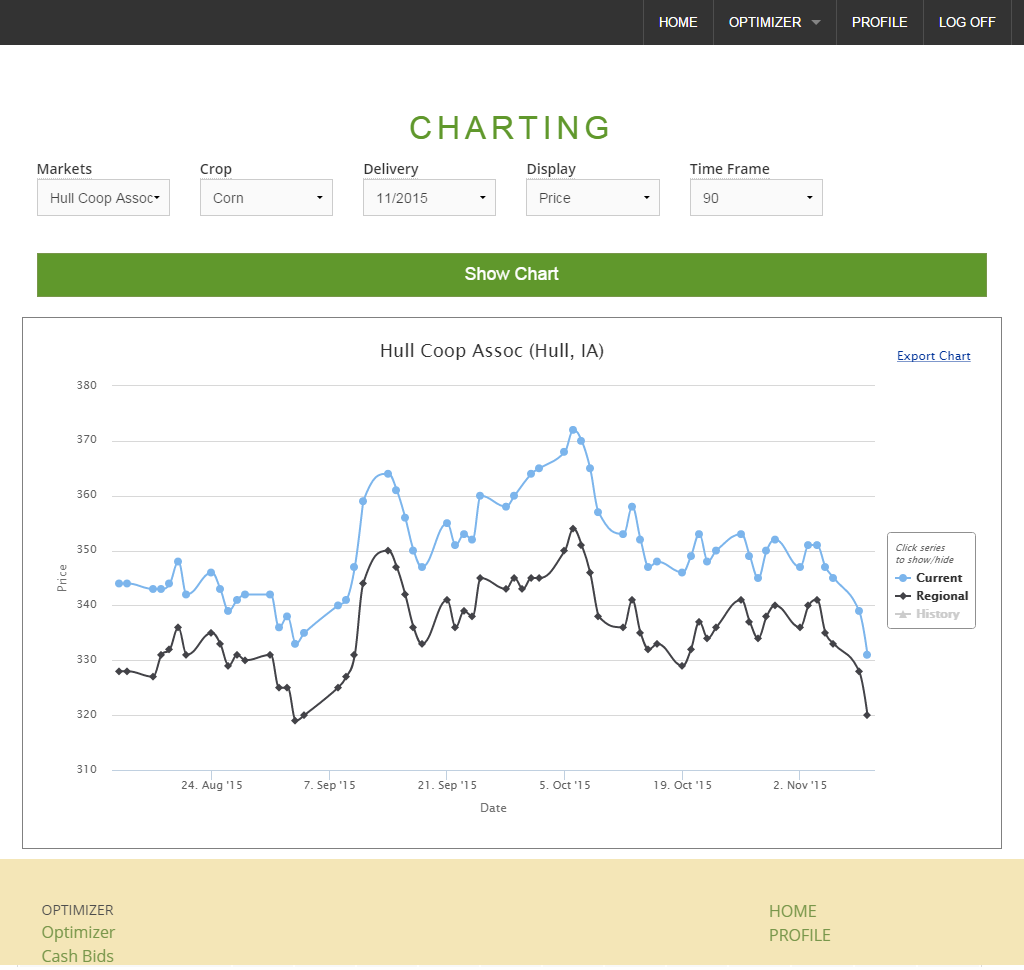
One of GeoGrain’s strength is the Optimizer, a tool within the app where you can plug in various trucking expenses and get real-time recommendations on where to most effectively deliver grain. You can also compare an elevator’s basis to the regional average.
This would be great for someone who wants to shop around for the best basis with every sale they make or truckload they spot sell. In my case, I’m more curious about setting basis for HTAs contracts I have at a few elevators I regularly work with. You can also view current basis relative to a simple average of the last X years which can be configured in your account settings, as well as a regional average of X miles away, also configurable in your account settings. I would personally like to see a bit more granularity and customization in the historical comparison where you could pick what specific years you want to compare to that might match a common theme (export-driven bull market year, drought year, planting scare year, etc), or do some technical analysis on the basis chart.
GeoGrain does offer a 14 day free trial, so definitely check it out and see if it will work for you.
Bottom line: for $50/month, GeoGrain gives you elevator-specific basis levels (current and historical) in a web dashboard. The reports are geared toward the seller who shops around, but may not provide enough in-depth querying for a specific merchant.
GeoGrain- Historical Data Purchase
In addition to their dashboard service, GeoGrain also sells historical datasets for use in your own analysis tools. The first ~300,000 days of data is a flat $500, then there’s a variable fee for data sets larger than that.
This is daily data and includes the basis and cash price (although I was told it only included basis when I purchased, so perhaps cash price is not guaranteed for all locations). So figuring 252 trading days in a year, 6 delivery periods bid at a time (let’s say), and 2 commodities, an elevator would produce about 3,000 data points per year. I doubt they have 100 years of data on any elevator, so to make the best use of your $500 you’ll want to select several locations and can certainly gain a lot of geographic insight from doing so.
I did end up buying historical data this way and imported it into my DIY data entry spreadsheet to make my historical comparisons come alive. I haven’t yet found a preferred technical analysis method for making quantitative decisions against this data, but that’s my next step.
Bottom line: if you want to analyze basis in your own tool and it’s not worth waiting to acquire it yourself, this is a straightforward process for buying historical data.
DTN ProphetX
ProphetX is primarily a trading and charting suite but they have been advertising an upcoming feature for basis charts and county averages. This is a part of ProphetX Platinum, which runs $420 / month according to a sales representative I spoke with. This doesn’t pencil out well for my intended use especially compared to a one-time purchase above, so I didn’t pursue it much further.
What works for you?
If there’s anything you should take from this, it’s that I’m still learning and always on the lookout for a better option. If you have a different insight about anything in this article, I’d genuinely like to learn about it and incorporate it in my practices. Leave a comment below or get in touch with me.