
Google Forms is one of my favorite data intake tools for its simplicity, ease of multi-device access, and price. I use a Google Form to digitize scale tickets which helps share the information between people (a truck driver can log a ticket and I can see it in a Google Sheet instantly) and of course makes totaling and moisture averaging much faster.
This article will highlight how I’ve structured my form and accompanying spreadsheet, instructions for setting up your own copy, and explanation of some custom Google Sheet functions I wrote to help with multi-entity ticket splits.
Which Data Points to Log
From a technical standpoint, a Google Form can log as much data as you want, but do you want to sit at the scale for 3 minutes filling out every data point on the ticket? Of course you won’t, so it would never get used.
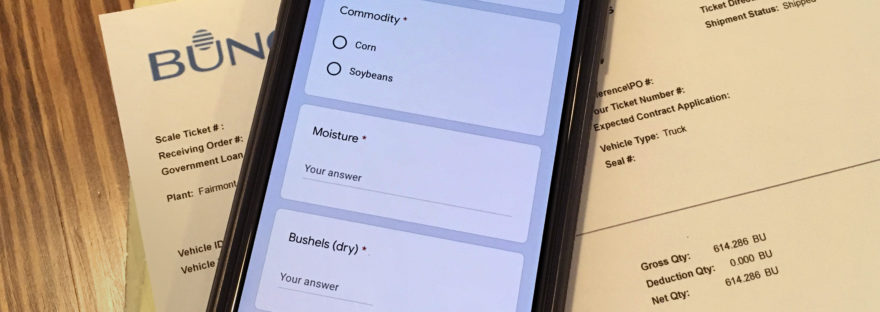
What I chose to log
- Ticket number
- Date (leave it blank to default to current day)
- Location
- Commodity
- Moisture
- Bushels
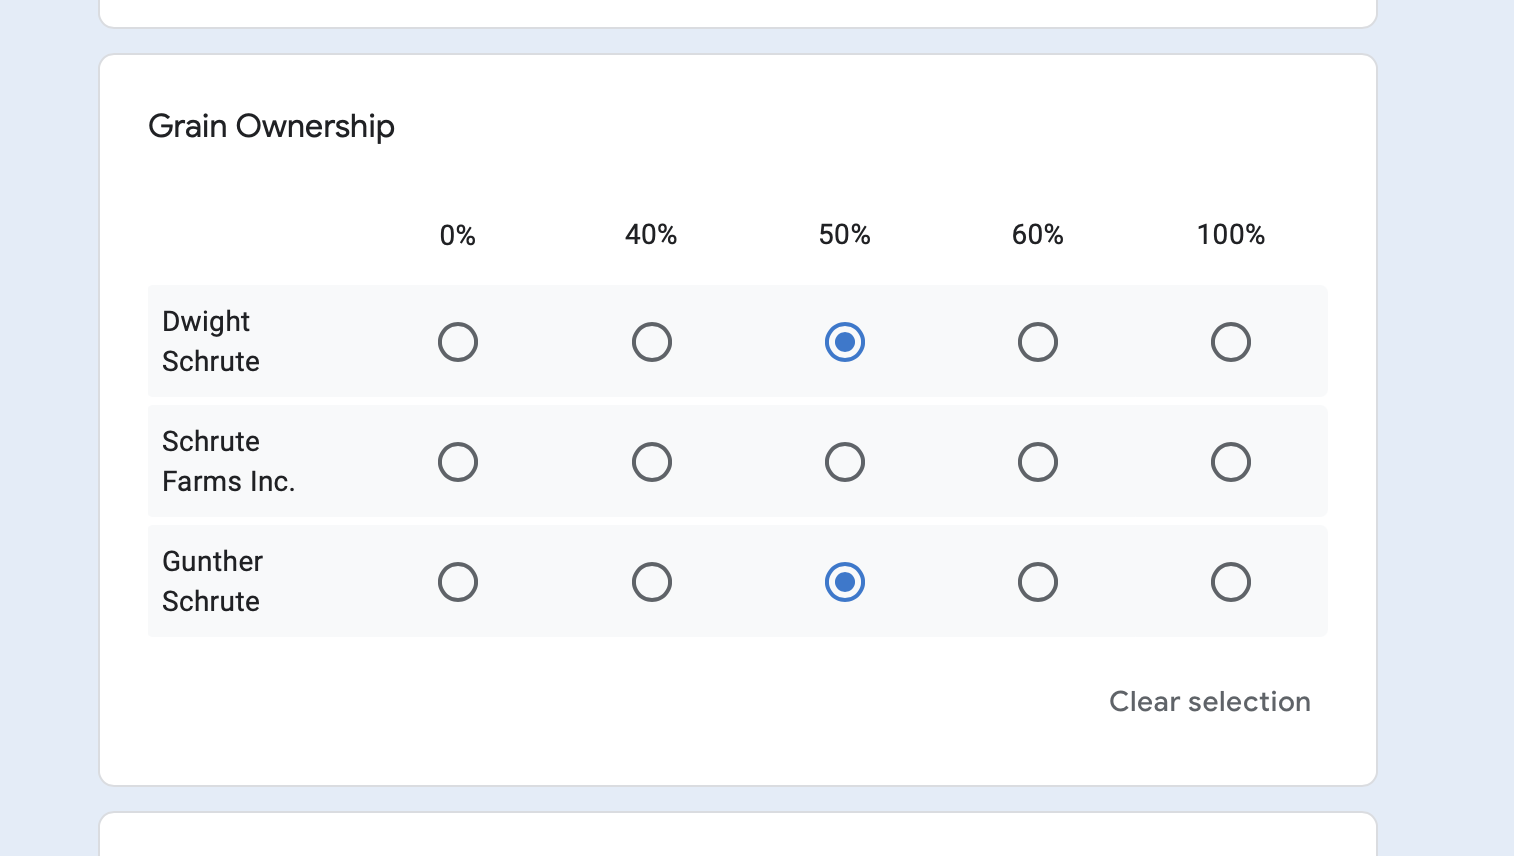
- Who owns what percent of the grain
- (Example of multi-select grid for grain ownership, which is greatly assisted by the custom function featured later)
- (Example of multi-select grid for grain ownership, which is greatly assisted by the custom function featured later)
- [Optional] Which bin/field did the grain come from?
Only 3 of these fields need to be typed in with a keyboard (ticket number, moisture, bushels) where as most of the others can be selected from a pre-populated radio button list or derived like Date.
In my experience, you can fill out a form within about 30 seconds after pulling off the scale which feels usable and not a logistical hinderance.
What I chose to not log
- Delivery type (contract, storage, spot, etc)
- Some tickets are split between multiple delivery types, so how would this be accounted for in a normalized way?
- Which specific contract this is delivered against
- The contract numbers would change each month and year, so you’d either have to retype them each time, or manually add them all to a radio button selection on the form
These are your decisions to make based on your operation, but there is a cost of added complexity to balance against better data. I felt it would be better to have rudimentary ticket data that everyone in the operation consistently uses than a perfect solution that’s too detailed for anyone to fill out.
Setting Up Form
If you’d like to set up your own form from scratch it’s pretty straightforward, plus there are many of great tutorials you can find online. In this section I’ll cover how to copy my form to your Google Drive.
1. Copy the following files to your Google Drive:
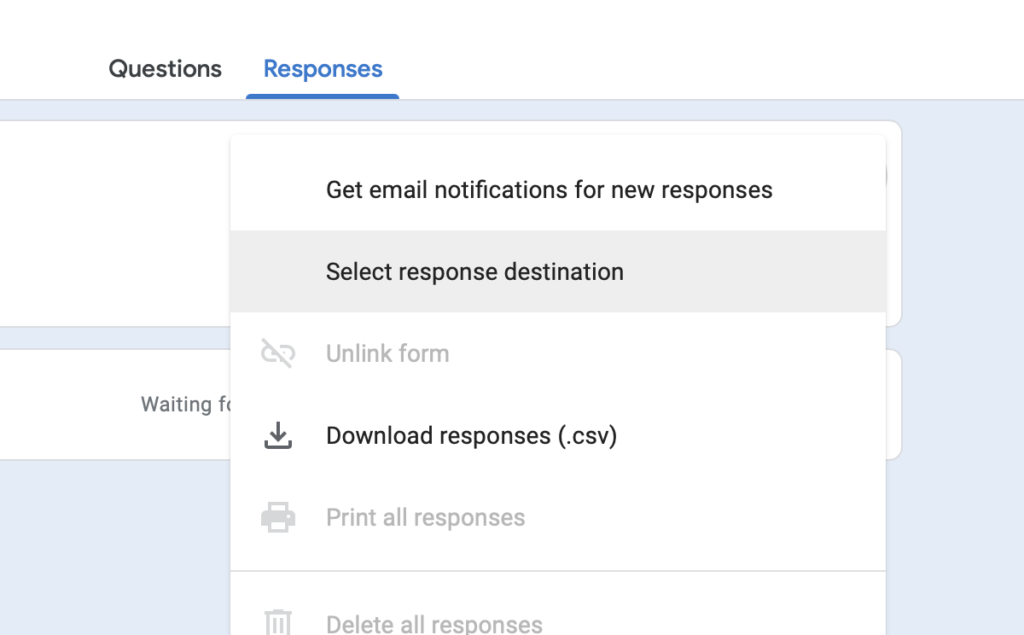
2. Open the Google Form. Go to the Responses tab, click the 3 dot menu button, then “Select response destination”
3. Click select existing spreadsheet, then click Select. Navigate to the scale ticket spreadsheet in your Drive and select it.
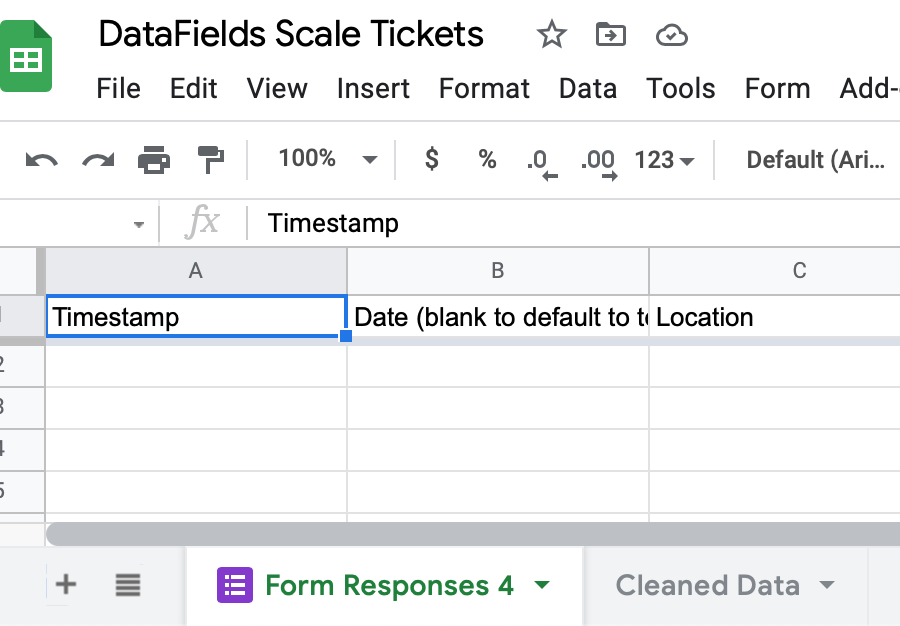
4. Now go to the scale ticket spreadsheet. You should have a sheet with a purple Google Forms logo called something starting with Form Responses. Click the dropdown arrow and rename it to something more natural, like “Scale Tickets”.
5. Now go to the Cleaned Data sheet and update the formula in cell A1 to reflect this name change as shown below. Notice the A:S selector; this will automatically include all rows, even as more are inserted.
=normalizeColumnSplit(mergeDates(removeDuplicates('Scale Tickets'!A:S,1,4),2,3),"Grain Ownership","Bushels (dry)","Net Weight (lbs)")You’ll get an error in this cell, but that’s because you don’t have any data yet.
6. Go back to the Google Form. I’ve included a few boilerplate locations and entities as an example which you’ll want to replace with your own.
7. Once you have those updated, click Send and you’ll have several options for sharing a link. Any changes you make in the future will be live at this link, so you don’t have to get everything perfect before sharing the link to your other people/devices.
You should now have the bare bones working: a form you can fill out on any device which will populate the raw “Scale Tickets” sheet, and a “Cleaned Data” sheet which you can use to create a pivot table or chart. I’ve included 2 simple pivot tables showing daily totals by owner and location. You can easily make your own or adjust these to your needs.
Custom Functions
So what’s special about the “Cleaned Data” sheet? I’ve written 3 custom functions to clean and rearrange the raw form data; explaining what each formula does will provide an understanding of the difference between the form data and Cleaned Data.
removeDuplicates(<input range>, <unique column index>, <unique column index>)
removeDuplicates does exactly what you’d expect: it takes in the tabular data in the input range position, and one or two column indexes to use in determining unique rows. This is helpful because if you leave a browser on the landing page after submitting a ticket and accidentally refresh the page hours later, you can end up with duplicates.
For example, if column 3 is ticket number and column 4 is location, this will prevent duplicate ticket numbers within each location. In most cases going by ticket number alone is probably enough, but including location prevents the freak chance that you get a ticket #1234 from Elevator A and a different but equally numbered ticket #1234 from Elevator B.
mergeDates(<input range>, <timestamp column index>, <manual date column index>)
Remember how the form includes a field to manually enter a date other than the date the form was submitted? This formula checks to see if the manual date if empty or filled. If it’s filled, that’s taken as the date. If it’s empty, it populates it with the date/time the form was submitted. All of this goes in a simple “Date” column. This makes the form much faster to use by eliminating another field that has to be filled out, especially one that annoyingly has separate input fields for day/month/year.
normalizeColumnSplit(<input range>, <ownership column prefix>, <bushel column name>)
This formula is the most complex but also quite helpful. In a nutshell, it splits up tickets that are owned by multiple entities into multiple smaller tickets each owned 100% by an entity. Instead of having a wide table with many columns of ownership percentages, you end up with a skinnier table which is much easier to query and aggregate in pivot tables.
The ownership column prefix (“Grain Ownership” in this case) tells the script which columns to extract the owner name from and process percentages, and the bushel column name is used to identify the column with the total number of bushels for that ticket.
Example of original data with multiple owner columns:
| Ticket Number | Date | Location | Bushels | Grain Ownership [Dwight Schrute] | Grain Ownership [Schrute Farms Inc.] | Grain Ownership [Gunther Schrute] |
| 1234 | 9/15/2021 | Mongous Grain Company | 950 | 50% | 50% | |
| 4321 | 9/16/2021 | Springfield Farmers Co-Op | 1080 | 100% |
Below is the normalized data with one owner column and multiple rows as needed.
| Ticket Number | Date | Location | Bushels | Owner |
| 1234 | 9/15/2021 | Mongous Grain Company | 475 | Dwight Schrute |
| 1234 | 9/15/2021 | Mongous Grain Company | 475 | Gunther Schrute |
| 4321 | 9/16/2021 | Springfield Farmers Co-Op | 1080 | Dwight Schrute |
Taller/skinnier tables like this with known number of columns are much easier to work with in pivot tables and charts.
So to recap, the cleaned data has all duplicate tickets removed, fills the date column accordingly, and normalizes the ownership data into a format that is very friendly for queries.

Below is the code for these formulas if you’d like to implement them on an existing Google Sheet. You can add custom formulas by going to Tools > Script editor.
function normalizeColumnSplit(input, ownershipPrefix, totalBushelsColumnName) {

  //get the input column headings from the first row and store them in an array for future reference
  var inputColumnHeadings = [];
  for (var c = 0; c < input[0].length; c++){
    inputColumnHeadings.push(input[0][c]);
  }

  //array of maps for output data
  var outputRowMaps = [];

  //iterate through each row of input
  for(var r = 1; r < input.length; r++){
    //ticketLevelColumnsMap will contain all the columns that apply across all ownership rows
    var ticketLevelColumnsMap = new Map();

    //ownershipMap will contain key/value pairs of owner names and bushel percentage
    var ownershipMap = new Map();

    //iterate through each column of input row
    for (var c = 0; c < input[r].length; c++){
      var cellValue = input[r][c];

      //if the current column contains the ownership prefix, capture the owner name and bushels and set it aside in ownershipMap
      if(inputColumnHeadings[c].includes(ownershipPrefix)){
        if(cellValue > 0){
          var cleanedName = inputColumnHeadings[c].replace(ownershipPrefix,"");
          cleanedName = cleanedName.replace("[","");
          cleanedName = cleanedName.replace("]","");
          cleanedName = cleanedName.trim();
          ownershipMap.set(cleanedName,cellValue)
        }
      //write all other data through as-is
      } else {
        ticketLevelColumnsMap.set(inputColumnHeadings[c],input[r][c])
      }
    }

    //store the total bushels for the ticket to be computed by owner
    var totalTicketBushels = ticketLevelColumnsMap.get(totalBushelsColumnName);

    //for each onwer/bushel pair, set an owner column and update the bushel column with the percentage split
    for (owner of ownershipMap.keys()){
      var outputRowMap = new Map(ticketLevelColumnsMap);
      outputRowMap.set(ownershipPrefix, owner);
      outputRowMap.set(totalBushelsColumnName, ownershipMap.get(owner)*totalTicketBushels);
      outputRowMaps.push(outputRowMap);
    }
  }

  //get output column headings
  var outputColumnHeadings = Array.from(outputRowMaps[0].keys());

  //simple array output with column headings array in first row
  var outputArray = [outputColumnHeadings];

  //step through each row and column of outputRowMaps, convert to a simple 2D array
  for (var r = 0; r < outputRowMaps.length; r++){
    var columnArray = [];
    for(var c = 0; c < outputColumnHeadings.length; c++){
      columnArray.push(outputRowMaps[r].get(outputColumnHeadings[c]));
    }
    outputArray.push(columnArray);
  }

  return outputArray;
}


function mergeDates(dataArray, timestampColumnIndex, manualDateColumnIndex){
  var ouputArray = [];
  for(var r = 0; r < dataArray.length; r++){
    var outputRow = dataArray[r];

    if(outputRow[manualDateColumnIndex-1] == "" && outputRow[timestampColumnIndex-1] != ""){
        var dateObject = new Date(outputRow[timestampColumnIndex-1]);
        var dateOnlyObject =new Date(dateObject.toDateString());
        outputRow[manualDateColumnIndex-1] = dateOnlyObject;
    }
    ouputArray.push(outputRow);
  }
  ouputArray[0][manualDateColumnIndex-1] = "Date";

  return ouputArray;
}

function removeDuplicates(dataArray, columnIndex1, columnIndex2){
  var rowMap = new Map();

  for(var i = 0; i < dataArray.length; i++){
    var column1Value;
    var column2Value;

    if(columnIndex1){
      column1Value = dataArray[i][(columnIndex1-1)]+"";
      column1Value = column1Value.trim();
    }

    if(columnIndex2){
      column2Value = dataArray[i][(columnIndex2-1)]+"";
      column2Value = column2Value.trim();
    }

    var uniqueId = column1Value+column2Value;
    rowMap.set(uniqueId, dataArray[i]);
  }

  return Array.from(rowMap.values());

}