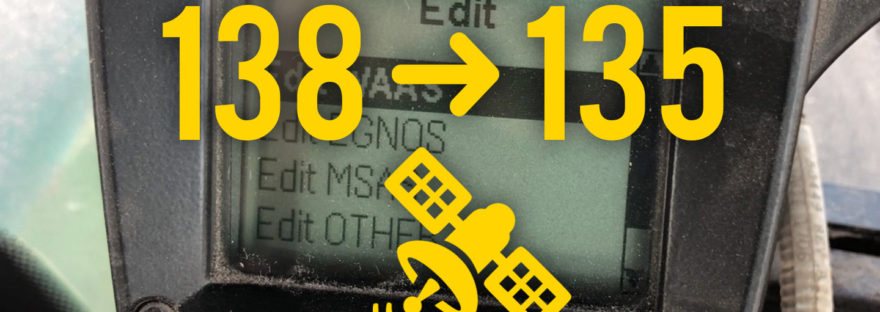
On May 17th 2022, the FAA shut down WAAS correction satellite 138, replacing it with WAAS satellite 135. If you’re seeing “Low Accuracy No Corrections” since this change, you’ll need to adjust your corrections.
Instructions
Navigate to Config menu > GPS > Corrections > Edit
You can get to the Config menu by scrolling all the way down on the icons along the right side of the run screen. It’s a wrench icon.
Select Edit WAAS
Set the satellites to the following values
PRN-122: Off
POR: Off
PRN-135: On
PRN-138: Off
This should be all you need to do. Navigate back to the run screen and see if the Low Accuracy No Correction message goes away (this could take a few minutes).
Superstition
In theory, making the adjustment above should fix it. If it does not, consider returning to the the Corrections Edit page and setting the other correction types to the following values. I don’t know what all of these do, but I know that ours works with them set to these values.
This is an enhancement to the wiki server I use to document equipment and processes on our farm. Here is the initial article if you haven’t read it yet.
On my farm wiki server I have several pages with checklists for equipment prep and found myself wanting to check off each item as I work through the checklist. I created a simple template for a toggle checkbox that can be dropped in on any page to track completion.
Wiki Templates
In a MediaWiki server, a template is a saved chunk of HTML that can be reused anywhere in the site. This allows you to make something once and easily reuse it across the site without duplicating all the formatting and markup each time. Here’s MediaWiki’s template help page for more information.
Once this is all set up, I can add a clickable checkbox anywhere on a page by adding the following template reference:
{{Template: checkbox}}
Setup
In addition to creating the template, we’ll also need to add some custom CSS and Javascript to the common files in the wiki server. In order to easily access each of these three locations, I recommend creating a utility page to link to these obscure pages without manually typing in the URL and forgetting where these live in case you want to make changes down the road.
1. Create Utility Page
From the home page (or wherever is out of the way and accessible) create a link to a new page which will host links to these other pages that need to be edited. I called mine [[Wiki Utility Pages]] and put it at the bottom of my home page.
Once you open that link, paste in the following links:
Once you save this page, you should see the first two links in blue (since those files already exist) and the template link in red.
2. Add Custom CSS
Open the first link (Common.css). You should see an initial line at top that says “CSS placed here will be applied to all skins”. Edit the file and paste the following CSS below that line (and under any other CSS that may already be there)
This creates a function with the logic to invert between the checked and unchecked styles. The bottom line attaches this function to all elements with a class of “listCheckBox”
4. Create Checkbox Template
Lastly, follow the link to the checkbox template to create the template. Paste the following code in:
Google Forms is one of my favorite data intake tools for its simplicity, ease of multi-device access, and price. I use a Google Form to digitize scale tickets which helps share the information between people (a truck driver can log a ticket and I can see it in a Google Sheet instantly) and of course makes totaling and moisture averaging much faster.
This article will highlight how I’ve structured my form and accompanying spreadsheet, instructions for setting up your own copy, and explanation of some custom Google Sheet functions I wrote to help with multi-entity ticket splits.
Which Data Points to Log
From a technical standpoint, a Google Form can log as much data as you want, but do you want to sit at the scale for 3 minutes filling out every data point on the ticket? Of course you won’t, so it would never get used.
What I chose to log
Ticket number
Date (leave it blank to default to current day)
Location
Commodity
Moisture
Bushels
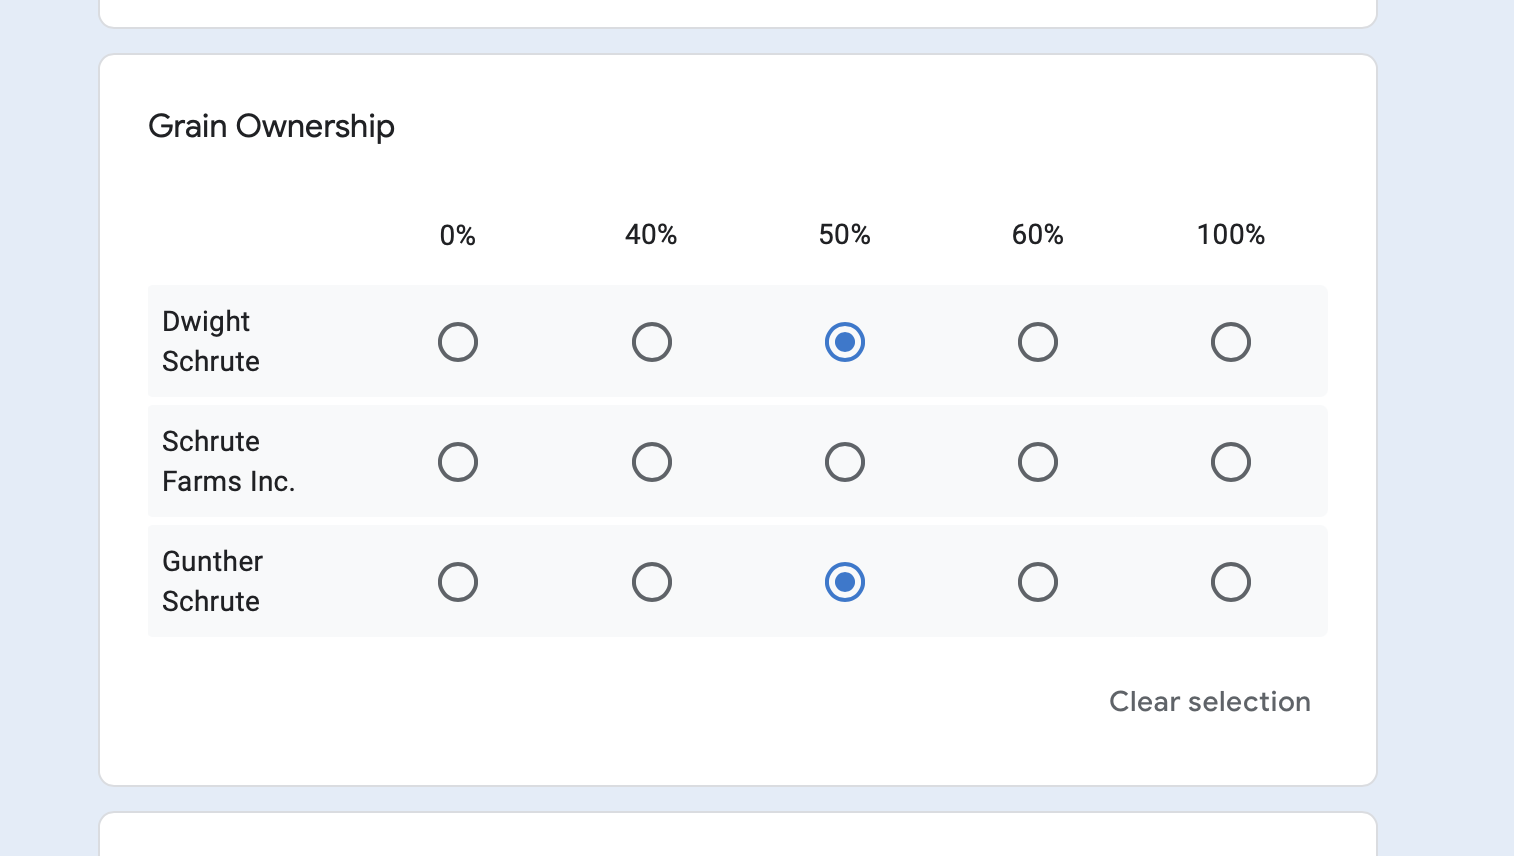
Who owns what percent of the grain
(Example of multi-select grid for grain ownership, which is greatly assisted by the custom function featured later)
[Optional] Which bin/field did the grain come from?
Only 3 of these fields need to be typed in with a keyboard (ticket number, moisture, bushels) where as most of the others can be selected from a pre-populated radio button list or derived like Date.
In my experience, you can fill out a form within about 30 seconds after pulling off the scale which feels usable and not a logistical hinderance.
What I chose to not log
Delivery type (contract, storage, spot, etc)
Some tickets are split between multiple delivery types, so how would this be accounted for in a normalized way?
Which specific contract this is delivered against
The contract numbers would change each month and year, so you’d either have to retype them each time, or manually add them all to a radio button selection on the form
These are your decisions to make based on your operation, but there is a cost of added complexity to balance against better data. I felt it would be better to have rudimentary ticket data that everyone in the operation consistently uses than a perfect solution that’s too detailed for anyone to fill out.
Setting Up Form
If you’d like to set up your own form from scratch it’s pretty straightforward, plus there are many of great tutorials you can find online. In this section I’ll cover how to copy my form to your Google Drive.
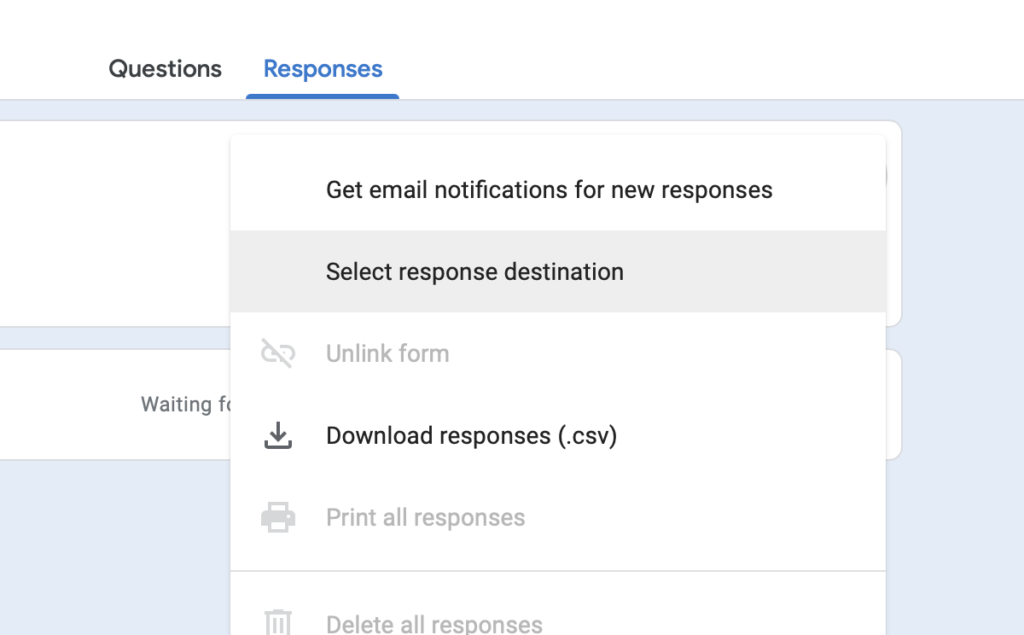
2. Open the Google Form. Go to the Responses tab, click the 3 dot menu button, then “Select response destination”
3. Click select existing spreadsheet, then click Select. Navigate to the scale ticket spreadsheet in your Drive and select it.
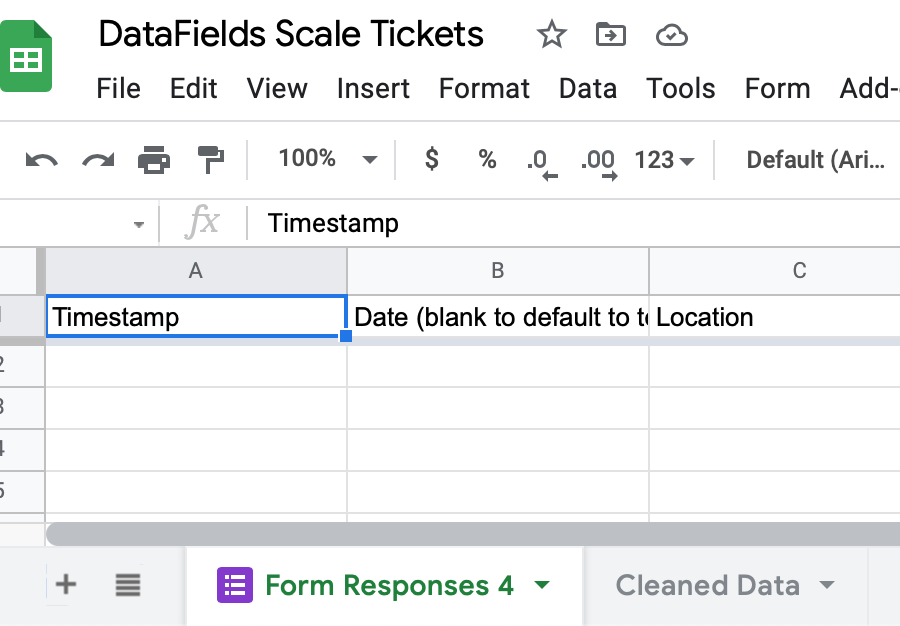
4. Now go to the scale ticket spreadsheet. You should have a sheet with a purple Google Forms logo called something starting with Form Responses. Click the dropdown arrow and rename it to something more natural, like “Scale Tickets”.
5. Now go to the Cleaned Data sheet and update the formula in cell A1 to reflect this name change as shown below. Notice the A:S selector; this will automatically include all rows, even as more are inserted.
You’ll get an error in this cell, but that’s because you don’t have any data yet.
6. Go back to the Google Form. I’ve included a few boilerplate locations and entities as an example which you’ll want to replace with your own.
7. Once you have those updated, click Send and you’ll have several options for sharing a link. Any changes you make in the future will be live at this link, so you don’t have to get everything perfect before sharing the link to your other people/devices.
You should now have the bare bones working: a form you can fill out on any device which will populate the raw “Scale Tickets” sheet, and a “Cleaned Data” sheet which you can use to create a pivot table or chart. I’ve included 2 simple pivot tables showing daily totals by owner and location. You can easily make your own or adjust these to your needs.
Custom Functions
So what’s special about the “Cleaned Data” sheet? I’ve written 3 custom functions to clean and rearrange the raw form data; explaining what each formula does will provide an understanding of the difference between the form data and Cleaned Data.
removeDuplicates does exactly what you’d expect: it takes in the tabular data in the input range position, and one or two column indexes to use in determining unique rows. This is helpful because if you leave a browser on the landing page after submitting a ticket and accidentally refresh the page hours later, you can end up with duplicates.
For example, if column 3 is ticket number and column 4 is location, this will prevent duplicate ticket numbers within each location. In most cases going by ticket number alone is probably enough, but including location prevents the freak chance that you get a ticket #1234 from Elevator A and a different but equally numbered ticket #1234 from Elevator B.
mergeDates(<input range>, <timestamp column index>, <manual date column index>)
Remember how the form includes a field to manually enter a date other than the date the form was submitted? This formula checks to see if the manual date if empty or filled. If it’s filled, that’s taken as the date. If it’s empty, it populates it with the date/time the form was submitted. All of this goes in a simple “Date” column. This makes the form much faster to use by eliminating another field that has to be filled out, especially one that annoyingly has separate input fields for day/month/year.
This formula is the most complex but also quite helpful. In a nutshell, it splits up tickets that are owned by multiple entities into multiple smaller tickets each owned 100% by an entity. Instead of having a wide table with many columns of ownership percentages, you end up with a skinnier table which is much easier to query and aggregate in pivot tables.
The ownership column prefix (“Grain Ownership” in this case) tells the script which columns to extract the owner name from and process percentages, and the bushel column name is used to identify the column with the total number of bushels for that ticket.
Example of original data with multiple owner columns:
Ticket Number
Date
Location
Bushels
Grain Ownership [Dwight Schrute]
Grain Ownership [Schrute Farms Inc.]
Grain Ownership [Gunther Schrute]
1234
9/15/2021
Mongous Grain Company
950
50%
50%
4321
9/16/2021
Springfield Farmers Co-Op
1080
100%
Below is the normalized data with one owner column and multiple rows as needed.
Ticket Number
Date
Location
Bushels
Owner
1234
9/15/2021
Mongous Grain Company
475
Dwight Schrute
1234
9/15/2021
Mongous Grain Company
475
Gunther Schrute
4321
9/16/2021
Springfield Farmers Co-Op
1080
Dwight Schrute
Taller/skinnier tables like this with known number of columns are much easier to work with in pivot tables and charts.
So to recap, the cleaned data has all duplicate tickets removed, fills the date column accordingly, and normalizes the ownership data into a format that is very friendly for queries.
(Required meme any time someone uses the word “normalize” while working in a spreadsheet)
Below is the code for these formulas if you’d like to implement them on an existing Google Sheet. You can add custom formulas by going to Tools > Script editor.
function normalizeColumnSplit(input, ownershipPrefix, totalBushelsColumnName) {

  //get the input column headings from the first row and store them in an array for future reference
  var inputColumnHeadings = [];
  for (var c = 0; c < input[0].length; c++){
    inputColumnHeadings.push(input[0][c]);
  }

  //array of maps for output data
  var outputRowMaps = [];

  //iterate through each row of input
  for(var r = 1; r < input.length; r++){
    //ticketLevelColumnsMap will contain all the columns that apply across all ownership rows
    var ticketLevelColumnsMap = new Map();

    //ownershipMap will contain key/value pairs of owner names and bushel percentage
    var ownershipMap = new Map();

    //iterate through each column of input row
    for (var c = 0; c < input[r].length; c++){
      var cellValue = input[r][c];

      //if the current column contains the ownership prefix, capture the owner name and bushels and set it aside in ownershipMap
      if(inputColumnHeadings[c].includes(ownershipPrefix)){
        if(cellValue > 0){
          var cleanedName = inputColumnHeadings[c].replace(ownershipPrefix,"");
          cleanedName = cleanedName.replace("[","");
          cleanedName = cleanedName.replace("]","");
          cleanedName = cleanedName.trim();
          ownershipMap.set(cleanedName,cellValue)
        }
      //write all other data through as-is
      } else {
        ticketLevelColumnsMap.set(inputColumnHeadings[c],input[r][c])
      }
    }

    //store the total bushels for the ticket to be computed by owner
    var totalTicketBushels = ticketLevelColumnsMap.get(totalBushelsColumnName);

    //for each onwer/bushel pair, set an owner column and update the bushel column with the percentage split
    for (owner of ownershipMap.keys()){
      var outputRowMap = new Map(ticketLevelColumnsMap);
      outputRowMap.set(ownershipPrefix, owner);
      outputRowMap.set(totalBushelsColumnName, ownershipMap.get(owner)*totalTicketBushels);
      outputRowMaps.push(outputRowMap);
    }
  }

  //get output column headings
  var outputColumnHeadings = Array.from(outputRowMaps[0].keys());

  //simple array output with column headings array in first row
  var outputArray = [outputColumnHeadings];

  //step through each row and column of outputRowMaps, convert to a simple 2D array
  for (var r = 0; r < outputRowMaps.length; r++){
    var columnArray = [];
    for(var c = 0; c < outputColumnHeadings.length; c++){
      columnArray.push(outputRowMaps[r].get(outputColumnHeadings[c]));
    }
    outputArray.push(columnArray);
  }

  return outputArray;
}


function mergeDates(dataArray, timestampColumnIndex, manualDateColumnIndex){
  var ouputArray = [];
  for(var r = 0; r < dataArray.length; r++){
    var outputRow = dataArray[r];

    if(outputRow[manualDateColumnIndex-1] == "" && outputRow[timestampColumnIndex-1] != ""){
        var dateObject = new Date(outputRow[timestampColumnIndex-1]);
        var dateOnlyObject =new Date(dateObject.toDateString());
        outputRow[manualDateColumnIndex-1] = dateOnlyObject;
    }
    ouputArray.push(outputRow);
  }
  ouputArray[0][manualDateColumnIndex-1] = "Date";

  return ouputArray;
}

function removeDuplicates(dataArray, columnIndex1, columnIndex2){
  var rowMap = new Map();

  for(var i = 0; i < dataArray.length; i++){
    var column1Value;
    var column2Value;

    if(columnIndex1){
      column1Value = dataArray[i][(columnIndex1-1)]+"";
      column1Value = column1Value.trim();
    }

    if(columnIndex2){
      column2Value = dataArray[i][(columnIndex2-1)]+"";
      column2Value = column2Value.trim();
    }

    var uniqueId = column1Value+column2Value;
    rowMap.set(uniqueId, dataArray[i]);
  }

  return Array.from(rowMap.values());

}
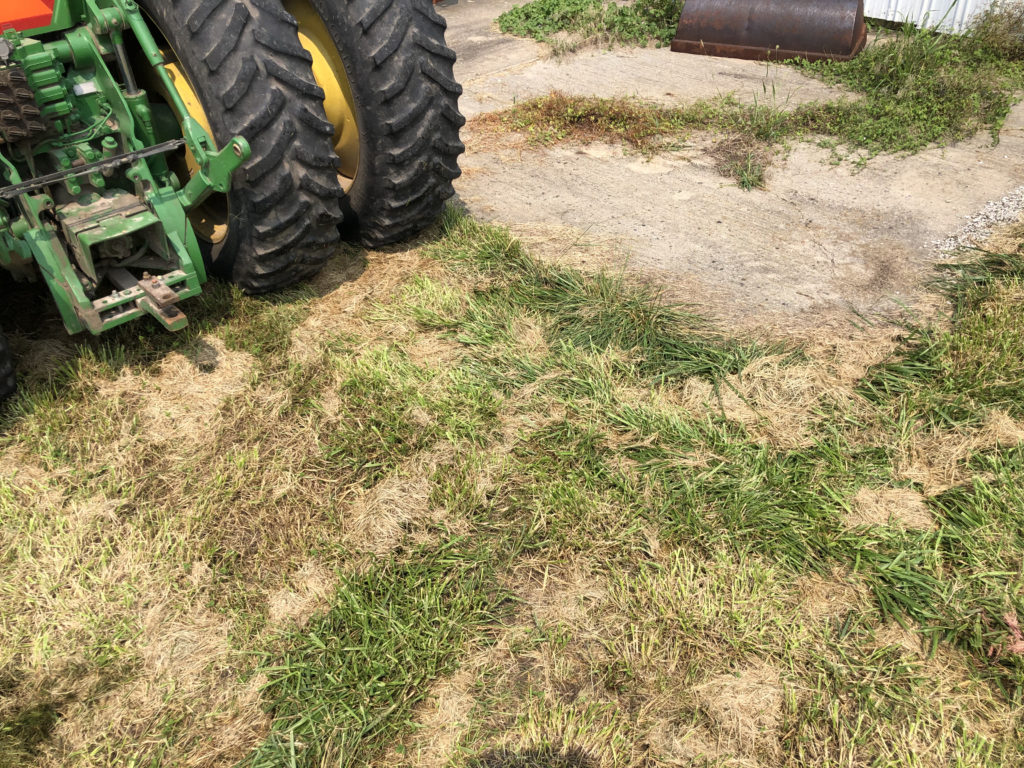
For several years we’ve had a wet area in a field which we suspect is due to a collapsed clay tile line. My dad had attempted to located the line once before without any luck. Last year I overheard a tip about using satellite photos to locate lines and decided to try to find it again while we were doing some other tiling work. I regret to admit that we were still unable to locate the line in a timely manner and had to move onto other jobs, but I learned a few tips that could be useful in this area.
I’m using the desktop version of Google Earth Pro, which is now free. You can download it here. From what I can tell, the browser version of Earth doesn’t support historical satellite imagery.
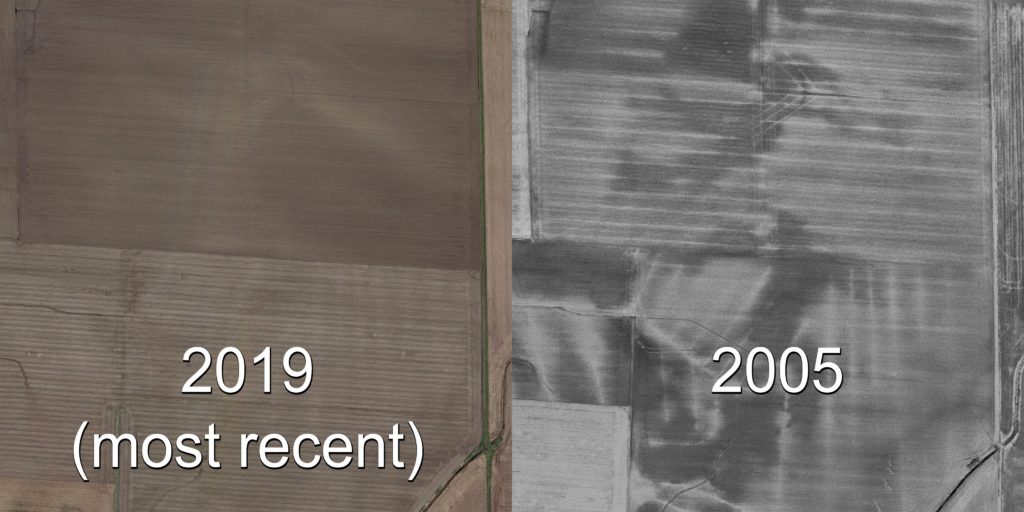
Find the Right Year
The most recent year available in a standard Google Maps satellite view may not show you much, but Google Earth allows you to view historical satellite photos from various years and months. After browsing through the available imagery, I discovered that imagery from March 2005 makes lines stand out clearly for my area.
This of course assumes the tile you’re looking for has been there for a couple decades, but presumably you’d have maps for anything done recently.
Translate to a Guidance Display
In some cases, you may be able to just measure in from a field boundary or a fixed object on the map and use that to locate the line in person with a tape measure. If that won’t work, the following steps outline how to translate what you see in Google Earth to lines on your guidance display.
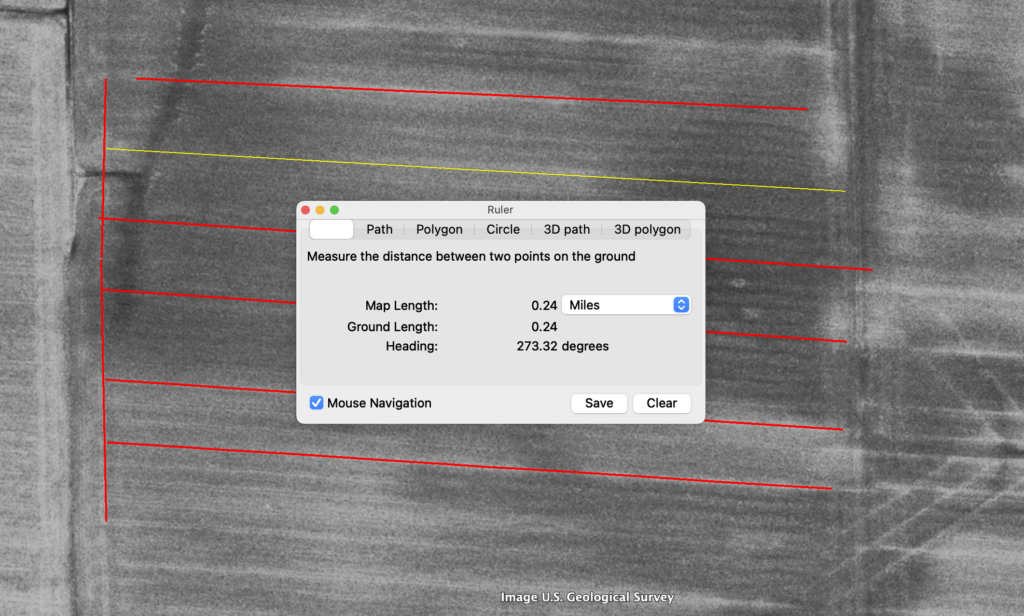
Overlay measuring lines
Using the ruler tool in Google Earth, lay down measure lines on the tile lines. You can squint, zoom in and out, and play with the A/B points until you have it centered to what looks correct. Then save this line in a folder in your Saved Places. Even if you don’t plan to export the latitude and longitude data, these lines can still be helpful for visualizing the tile map.
Copy Lines to Guidance System
Put all your saved tile lines in a folder in your Saved/Temporary Places, then right click on the folder, select Save Place As. (If you use a guidance system that can natively import KMZ/KML files, great! That will be much more straightforward and you can skip the rest of this.) If not, and you’ll want to access the lat/long data manually, save the file as a KML.º
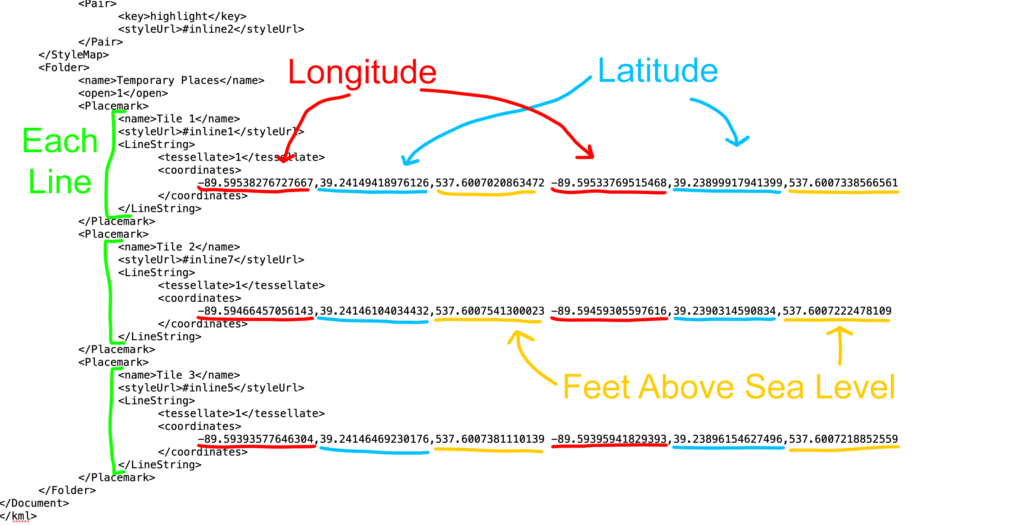
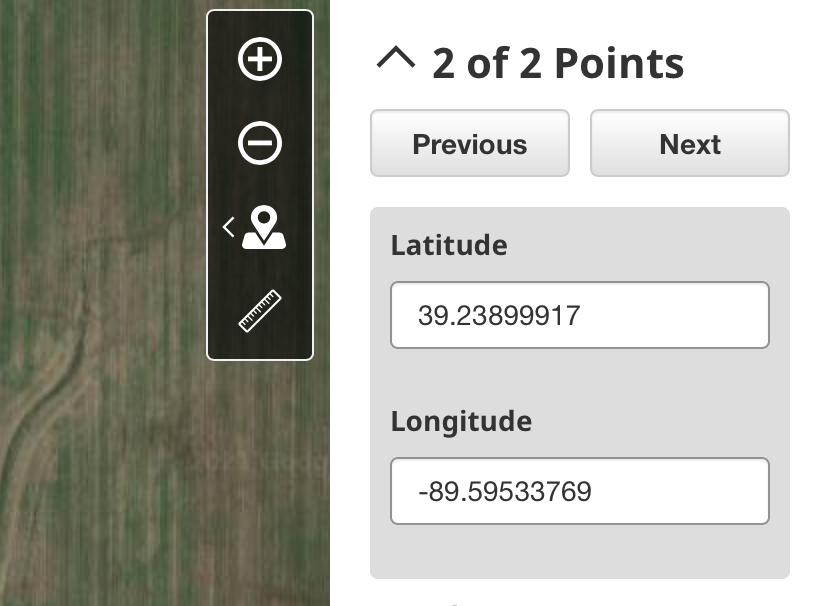
Open the KML file in a simple text editor like Notepad (Windows) or TextEdit (macOS). Scroll down to the second half of the file and look for lat/long pairs under a <coordinate> tag. Each <coordinate> tag contains six numbers, separated by commas, in the following order:
Point A longitude
Point A latitude
Point A feet above sea level
Point B longitude
Point B latitude
Point B feet above sea level
This might look intimidating, but it’s fairly liberating in a way; you can paste these lat/long points into whatever software you want or you could even key them directly into a display if you didn’t have very many.
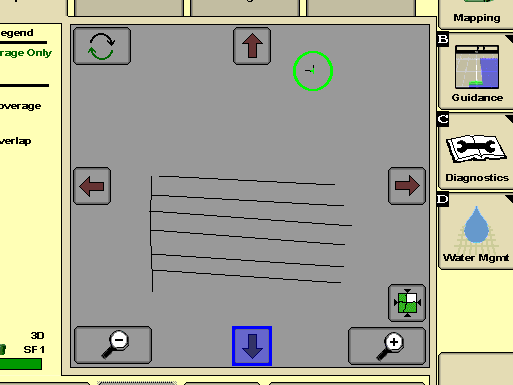
We use John Deere displays, so I created a flag (line type) in Land Manager for each of these lines, then pasted in the lat/long.
Note: when making a flag line, you’ll have to just click somewhere to make a 2 point line, then you can go back later and paste in the proper lat/long for each point.Flag lines on 2630 map
Calibrate with a Known Point
If you want to take lat/long coordinates from a satellite photo and go to them in the real world, there are at least two variables that impact the accuracy of this; 1) how accurately was the satellite photo stitched and 2) how much drift is being experienced by the receiver.
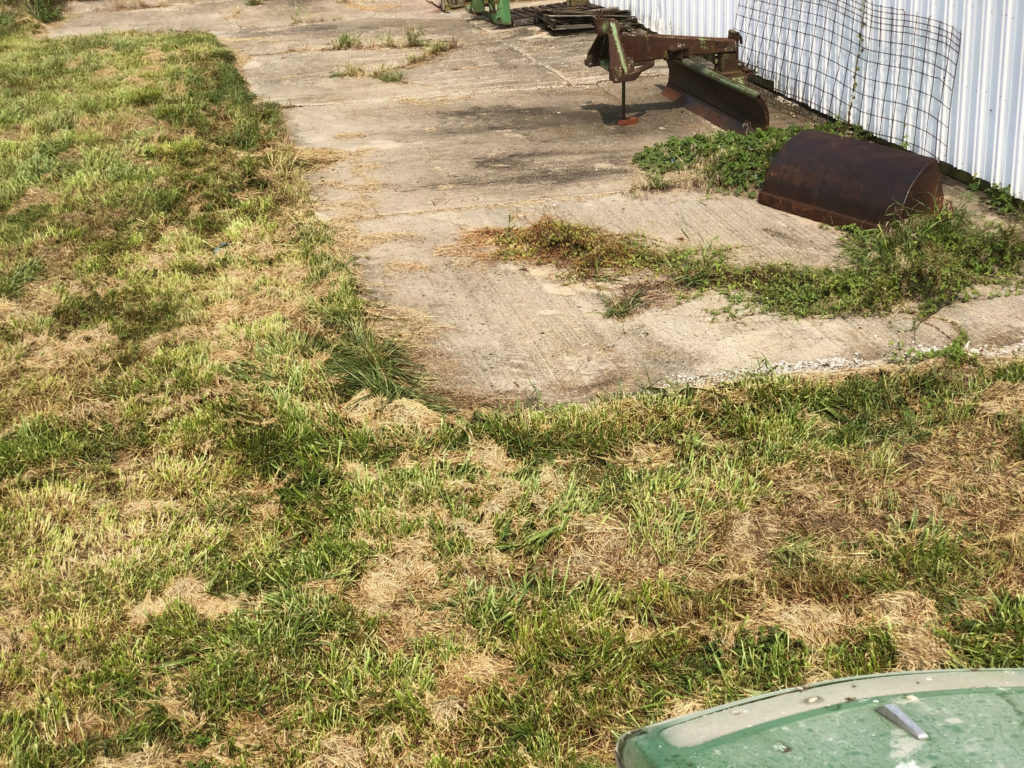
To account for this, find something nearby in the real world that appears clearly in the satellite photo and is unambiguously in the same location today.
Good candidates:
Concrete pads, well covers, etc
Fence posts
Road intersections
Building corners generally wouldn’t work well because you can’t sit directly next to / atop them and still have a wide view of the sky. You also run the risk of parallax distortion depending on how much of a side view the satellite captured and how tall the building is. (Watch for this on fence posts as well).
Concrete pad corner which I used
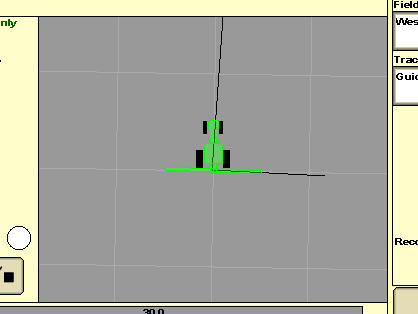
Mark this feature with lines in Google Earth using the same historical photo you used to mark the tile lines and bring those to your display as was shown earlier. Now align yourself so the drawbar on the display is at the reference point and compare your offset in the physical world.
2630 map showing my drawbar directly over the line cornerIn the real world, I’m about 6′ too far south and 7′ too far west.
Once you know your offset, you should be able to drive to what the screen shows as correct and measure back to the true location accordingly. Depending on the temporal accuracy of your GPS corrections, you may need to do this immediately. In our case we’re just using SF1, so I went directly to the tile line after getting this offset measurement and started placing flags.
“Says the guy who couldn’t find his tile line”
As I mentioned earlier, I can’t prove that this method works because I wasn’t actually able to locate the line we were looking for. But it seems really solid in theory, and as we all know, when something works in theory, it works in practice.
Let me know if you have any luck with this method or have any better/simpler ways of locating lines.
Despite John Deere’s sincerest wishes, not every piece of equipment that covers our fields has a GreenStar display in it. Not only do we have a mixed fleet of guidance systems, but getting raw GreenStar files from custom applicators is difficult or impossible.
John Deere Operations Center does not allow the import of third party shapefiles as a coverage map for Field Analyzer or Variety Locator. Last year, the Operations Center mobile app gained the ability to manually log field operations which automatically applies a single variety/product across an entire field for a given date/time. It’s crude and simple, but at least allows something to be logged without the requirement for a GreenStar display to be involved. I used this for our herbicide sprays since our sprayer does not have a GreenStar display and it works well given that we cover the whole field with the same rate of product and typically do so within a day or two.
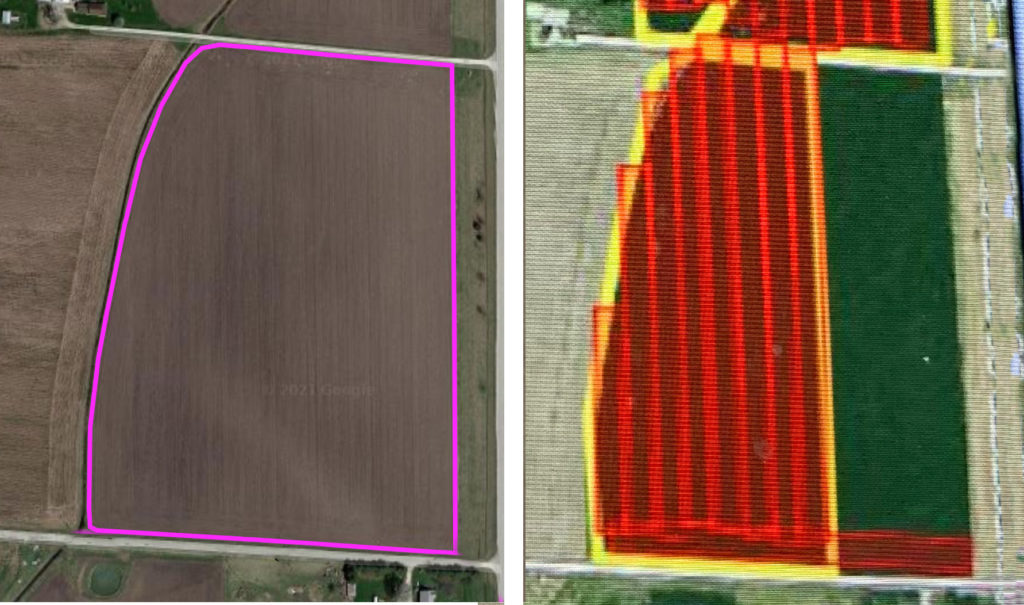
Where I ran into an issue was with a check strip from an aerial fungicide application. This ran perpendicularly across a corn variety test plot and I was sent a screenshot of the mapping output from AgriSmart’s Flight Plan Online. This got me thinking of a creative way to force the Operation Center mobile app to generate a partial coverage map so I could more easily do yield comparisons in the fall.
Overview of what you’ll need to do:
Create a field boundary that is the shape of only the area applied. Set it as the active field boundary.
Manually log an operation on that field in the mobile app.
Wait for the coverage map to finish processing, then change the active boundary back to the full field boundary.
1. Modify Field Boundary
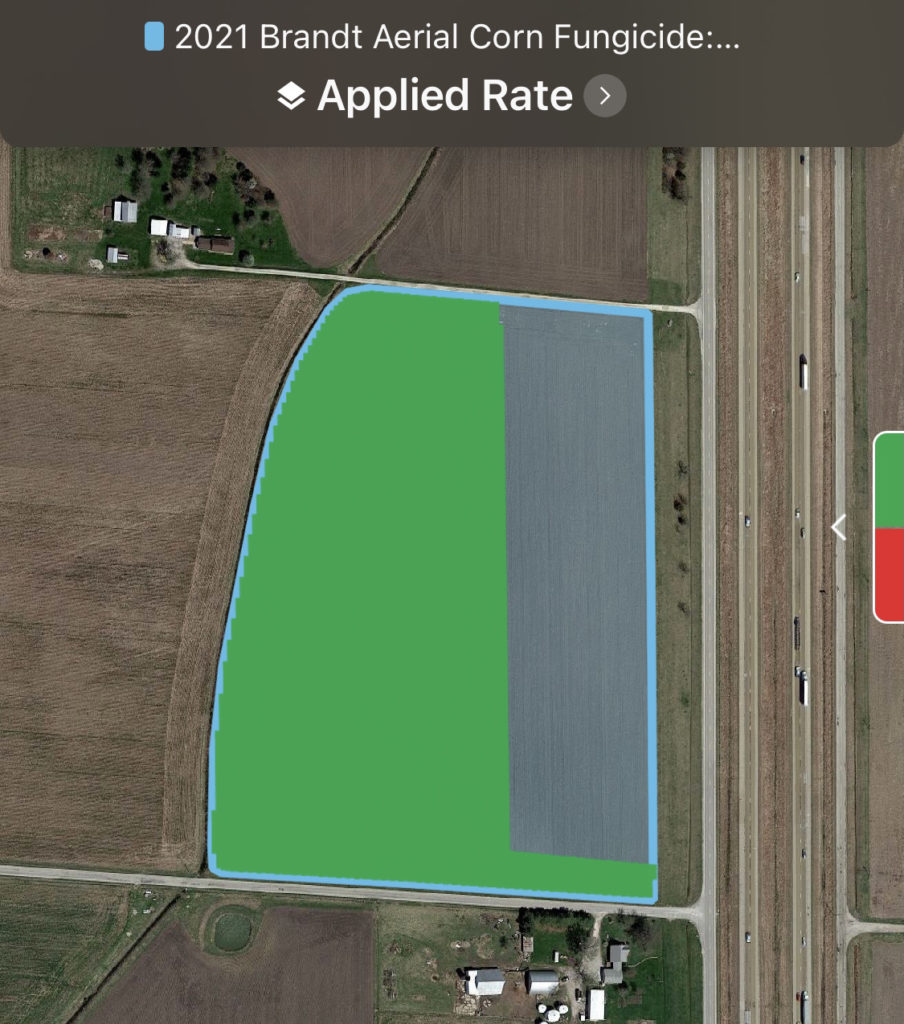
Field boundary in Operations Center (left) vs screenshot of coverage map sent by aerial applicator (right)
Above is the screenshot of the coverage map I was given. These are 80′ passes and from looking at the field to the north, 4 swaths worth were not sprayed. So a section ~320′ from the east side, excluding 80′ that was sprayed along the entire south end.
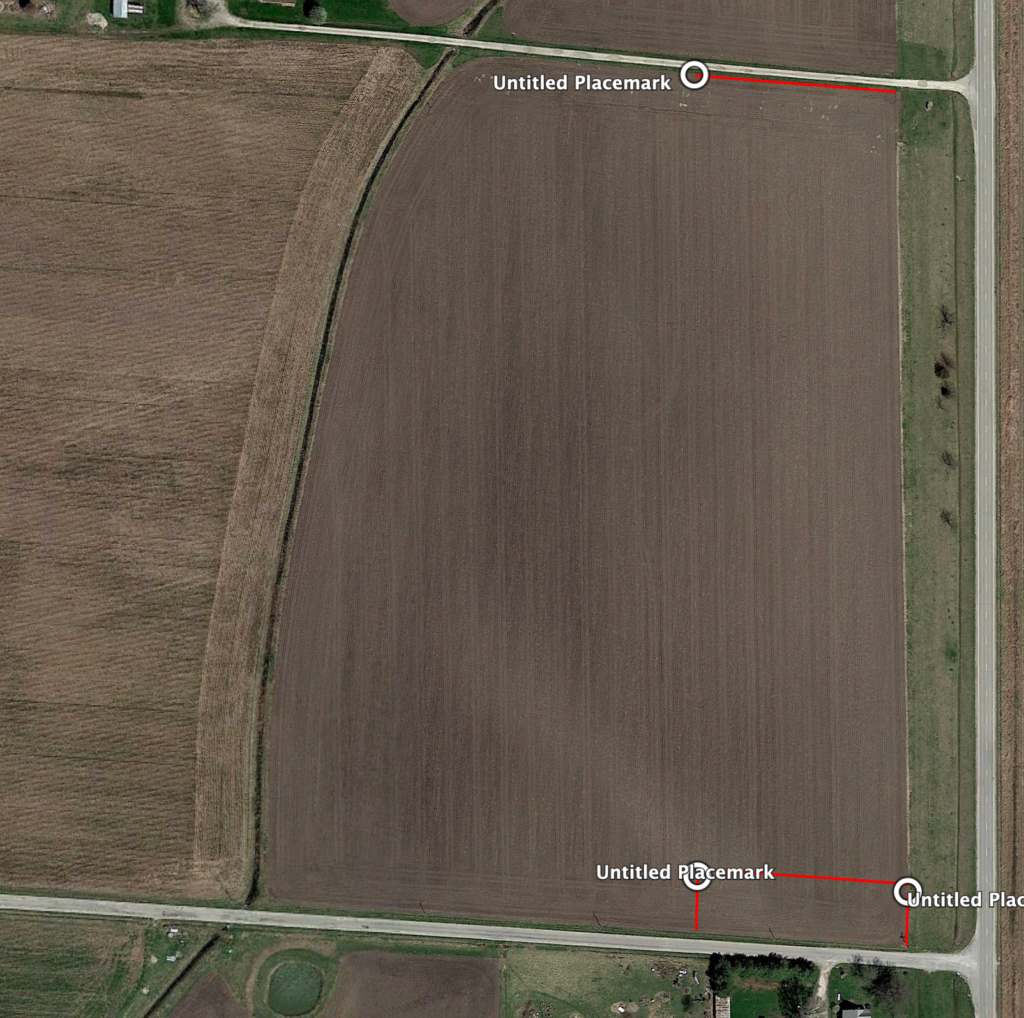
I used Google Earth to measure out this block and get latitude and longitude points for the 3 corners.
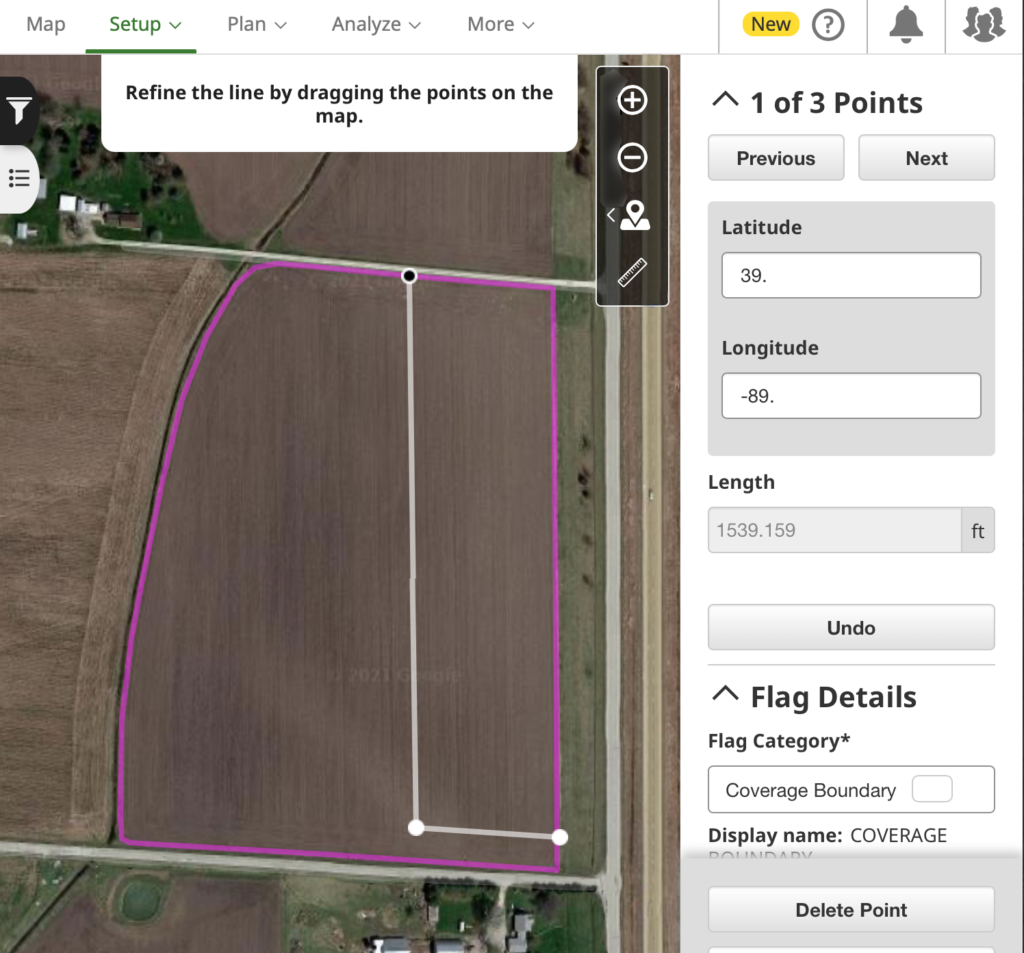
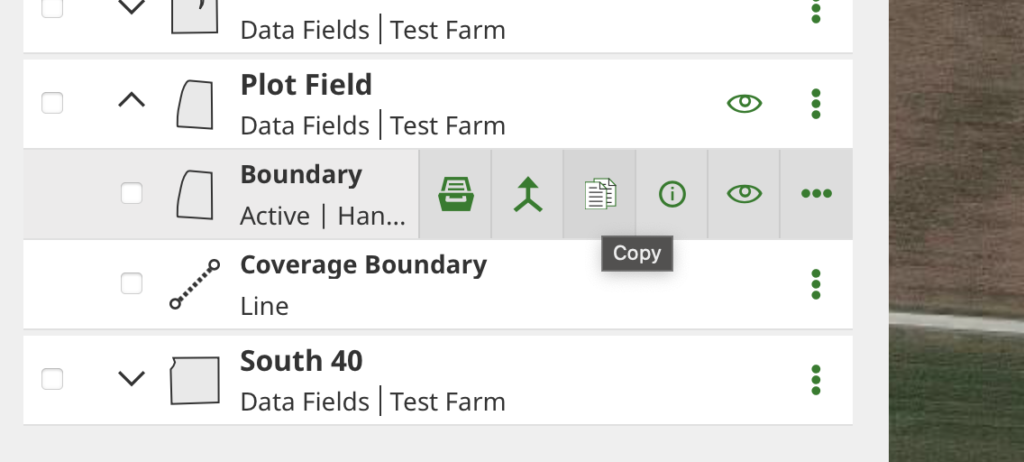
I added that as a Flag line in Operations Center (Land Manager) with a Flag Category of “Coverage Boundary” just for the sake of not junking up the tile hole or rock list. Note: you’ll have to click to lay down whatever points you’ll need first, then you can circle back and get the latitude/longitude correct.
Next, make a copy of your field boundary and name it something distinctive.
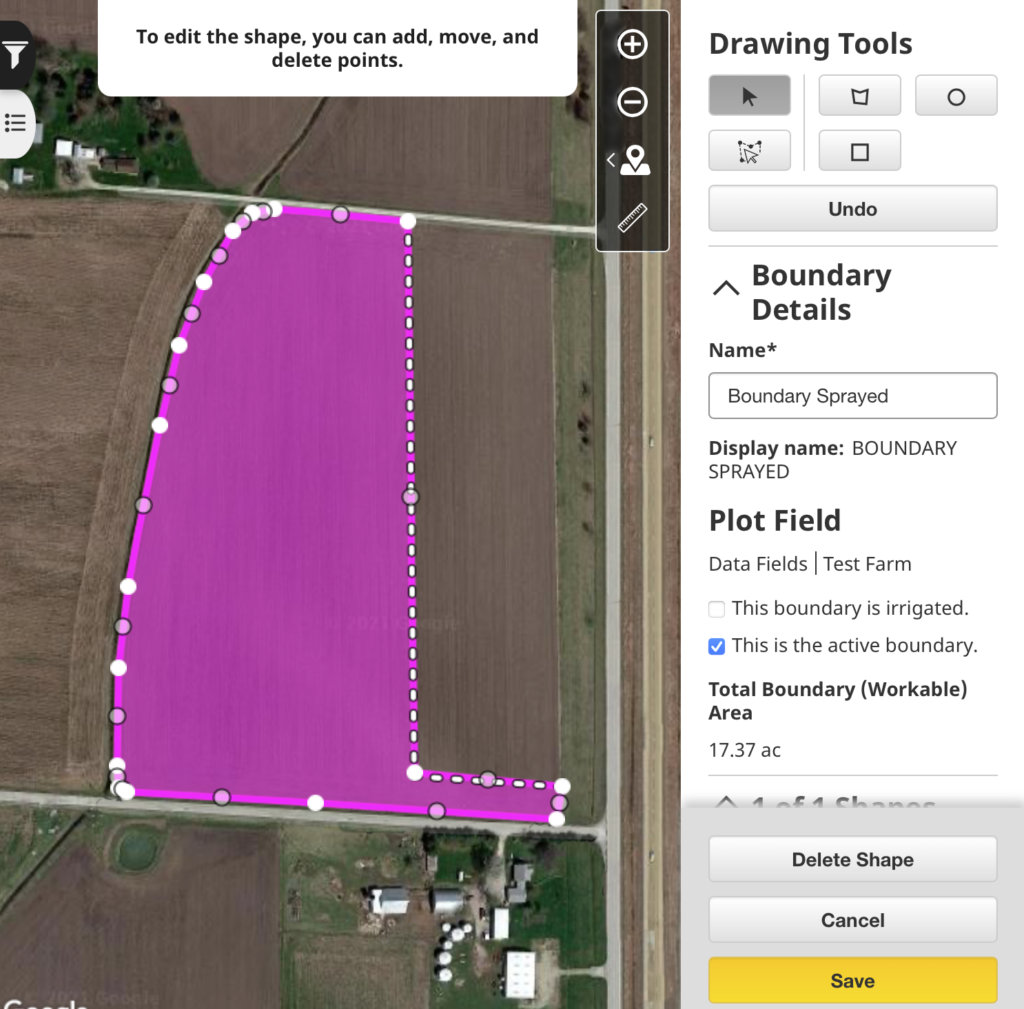
Make sure your flag line is visible (it also helps to have your old boundary invisible), then edit the new boundary and drag the edges to the flag line.
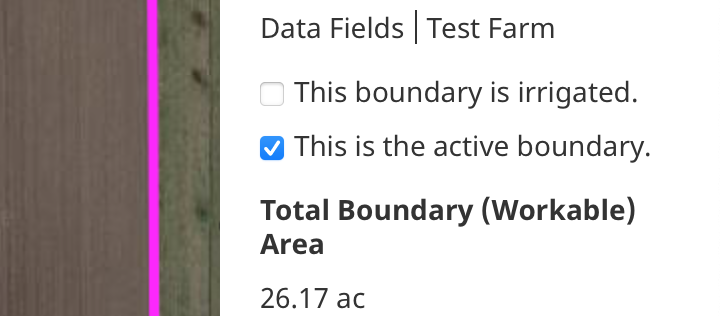
Make sure you check the box for “This is the active boundary”.
Once you have saved an active boundary that is the shape of what you want to apply, you’re ready to head to the mobile app.
2. Log operation in mobile app
⚠️ Field boundaries seem to cache for some period of time on the device and don’t reload when you open/close the app, even when clearing it from memory. To ensure that the mobile app has the most recent field boundary, log out of the app and back in.
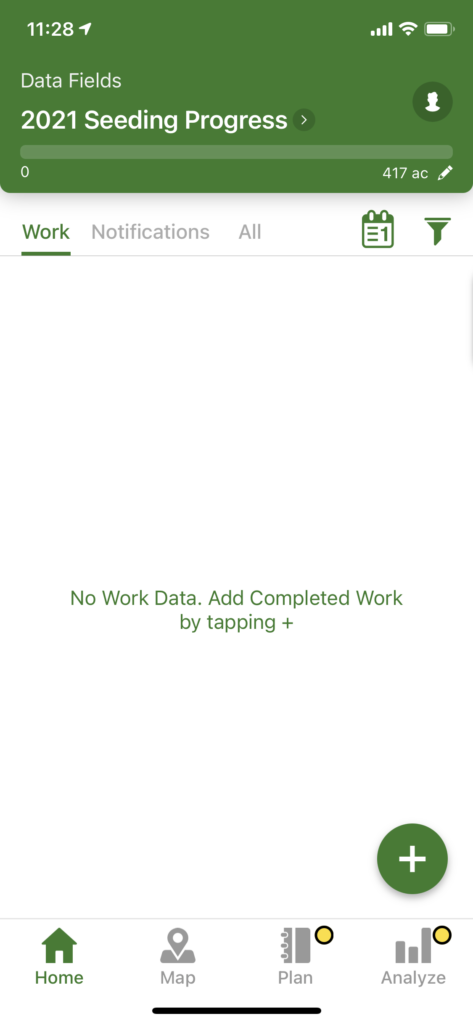
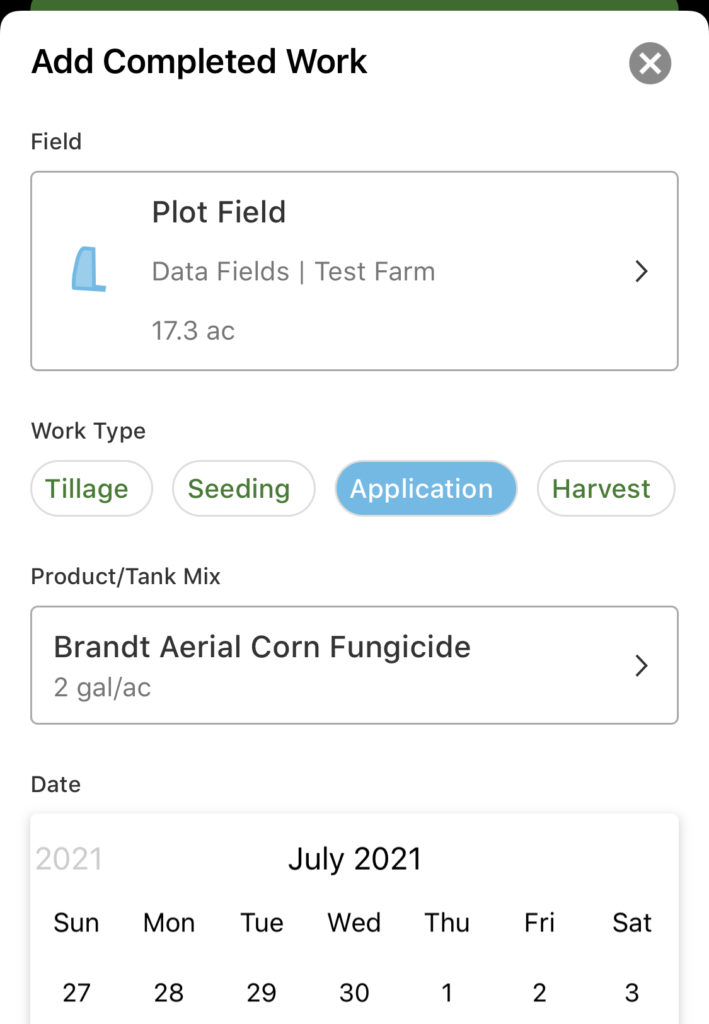
From the Home tab, tap the + circle to add an operation.
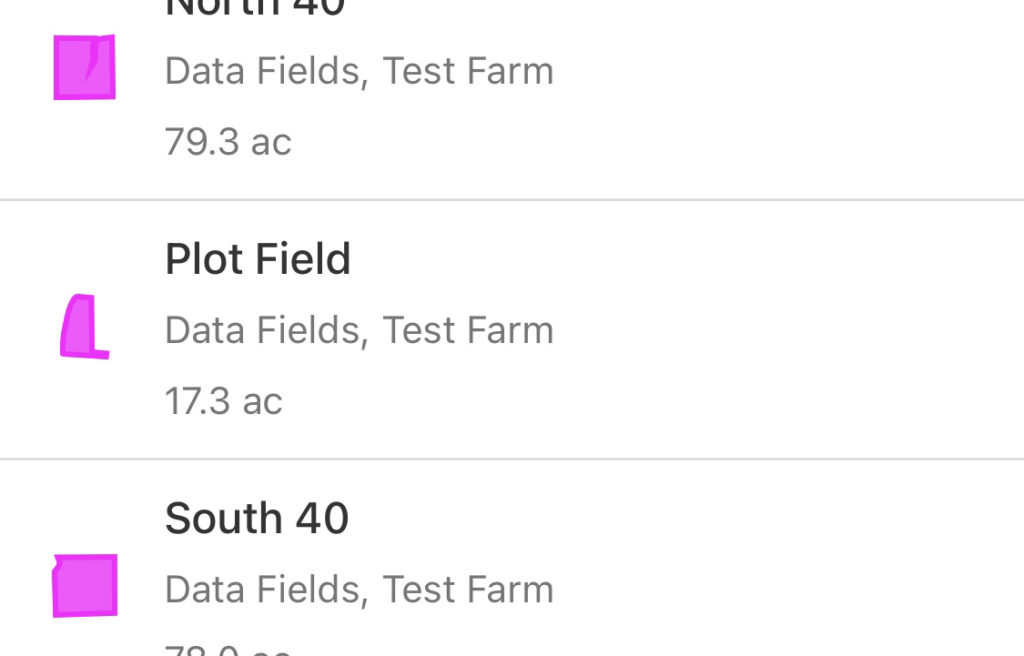
When you select the field, make sure the shape looks correct for the modified boundary.
Select your operation type and applicable products
Set the date/time and tap Save.
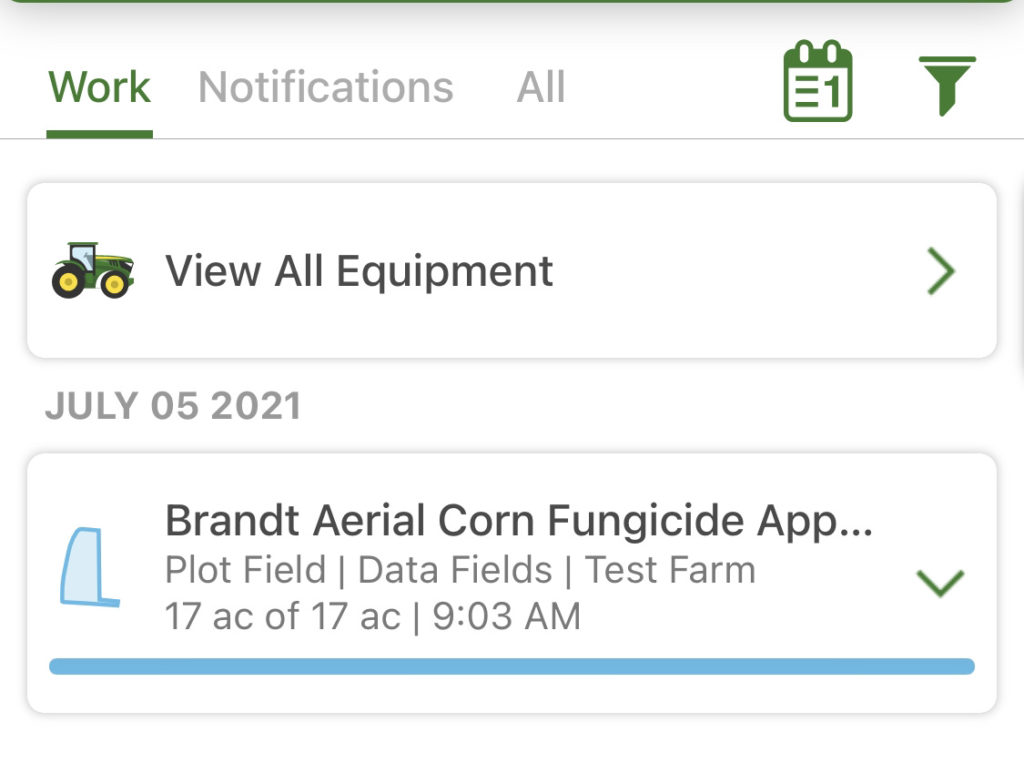
Eventually, you should see a single operation on the home tab.
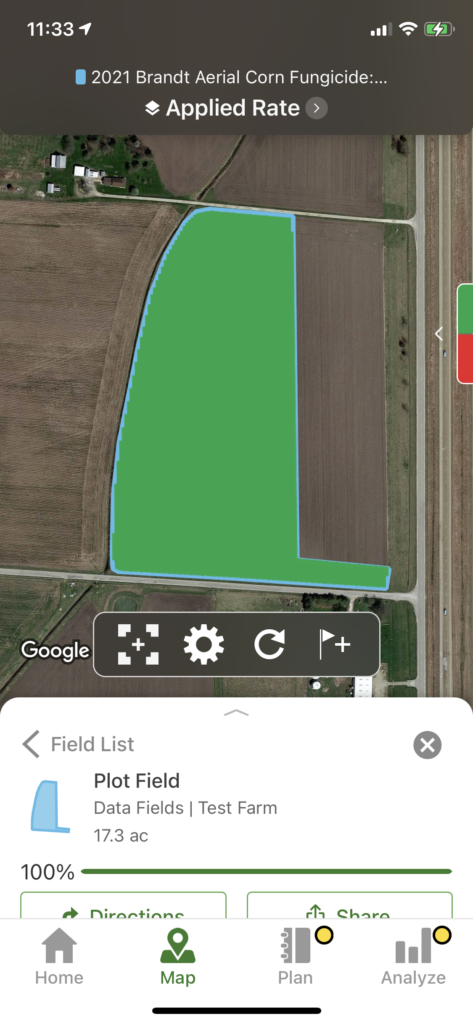
Once you can confirm from the Map tab that the coverage map has been created for the modified boundary, you’re all set! All that’s left to do is some clean up work to get the boundary back to normal.
3. Clean up boundaries in Operations Center
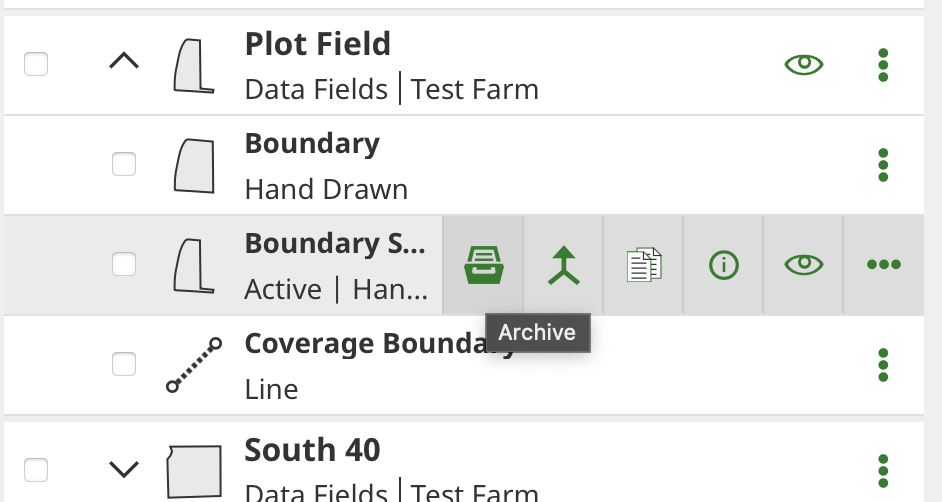
Return to Land Manager in the web version of Operations Center and archive the temporary boundary you created. You may consider leaving the flag line and syncing it to your display in the fall if you would like to see the application line from the cab.
Open the edit pane on your original boundary and check the box to make it the active boundary.
Lastly, given the cacheing of field boundaries by the mobile app, it’s a good idea to log out and back into the app to return to the original field boundary.
Open the map view for a victory lap- you should see a complete boundary but a partial coverage map. 👍
Legal disclaimer: all screenshots and functionality shown are of public versions of the software accessed via a fresh account.
John Deere Data Manager is a Windows-only program that simplifies the process of copying setup files to the proper location on a data card or flash drive. Since this is not available for macOS, Mac users have to manually copy the files to the proper location. This is a very simple process but one that I wasn’t able to find good documentation for when I first did it, so let me add an article to the internet explaining it succinctly.
⚠️ There is currently a bug when downloading from Files in Operations Center via Safari. Instead of downloading the zip file you intended, you’ll get download.html which just contains the text “not found”. You can either use Chrome in the mean time, or you can download the setup files via the File Details tab of the Setup File Creator (in the bottom section of the page there should be a list of previous setup files from the last 12 months. Click on the green circle next to the file to download. This still works in Safari.)
Flash Drive Format
Most flash drives come pre-formatted in FAT format which is old, but very compatible and fine for small files. In the event you need to reformat the drive via Disk Utility on macOS, select MS-DOS (FAT) and make sure you select Master Boot Record if given the option for a partition scheme. I had a hair pulling experience with a 2630 never recognizing a flash drive that was partitioned with GUID Partition Map. Here’s Apple’s guide for formatting a disk with Disk Utility.
Files are loaded to these displays on a flash drive via the USB port (if you’re reading this article I’ll assume you don’t have wireless data transfer). Here’s the top portion of how the file structure on the flash drive will need to end up:
[Top level of USB drive]
GS3_2630 ← equivalent of zip output
<Name of Setup File>
RCD
so on and so forth
ProductLayers ← will be present if you have Variety Locator data. Should be peer of GS3_2630
When you unzip the zip file you download from Files, you should have a folder called GS3_2630. If you only need that one setup file on the flash drive, you can copy that GS3_2630 folder to the top level of the flash drive (and ProductLayers if applicable) and you’ll be good to go.
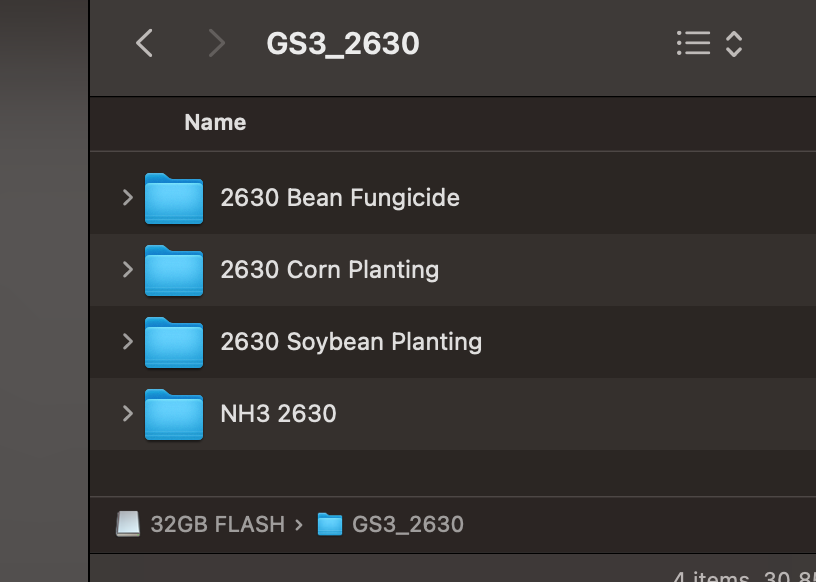
I often have several setup files on the same flash drive in a season, so I don’t want to overwrite the entire GS3_2630 folder. In this case, copy the <Name of Setup File> folder from the GS3_2630 folder of the zip output to the GS3_2630 folder on the flash drive.
Since ProductLayers is at the root of the drive and a peer to GS3_2630, you won’t be able to keep multiple Variety Locator configurations on the same drive.
Current state of my flash drive with multiple setup files in GS3_2630 folder.
GreenStar 3 CommandCenter
This works identically to the 2630, just a different name for the top level folder.
[Top level of USB drive]
Command_Center ← equivalent of zip output
<Name of Setup File>
RCD
so on and so forth
Again, you can copy the entire Command_Center folder to the drive, or just copy individual setup folders within it to retain multiple setups at the same time.
GreenStar 2 2600 Display
The 2600 is the oddball format since there’s no compartmentalization between internal and external storage; you just pull the compact flash card out, connect it to a card reader, and write files directly to it. Below is the file structure for the card.
<Top level of compact flash card>
RCD ← equivalent of zip output
Programs
Fonts
etc
The zip file you download from Files will unzip as an RCD folder. That can be placed directly in the top level of the data card, overwriting the existing RCD folder. If you want to back up the previous RCD folder, copy it off elsewhere first.
GreenStar 2 1800 Display
Despite its age, the 1800 works just like the GreenStar 3 file formats and uses the USB drive as a means of transporting data to the internal storage.
<Top level of USB drive>
GS2_1800 ← equivalent of zip output
<Name of Setup File>
RCD
so on and so forth
I don’t have hands on experience with the 1800 to verify the entire process, but I did confirm that this folder structure is what’s created by Data Manager on Windows when loading a setup file to an external drive.
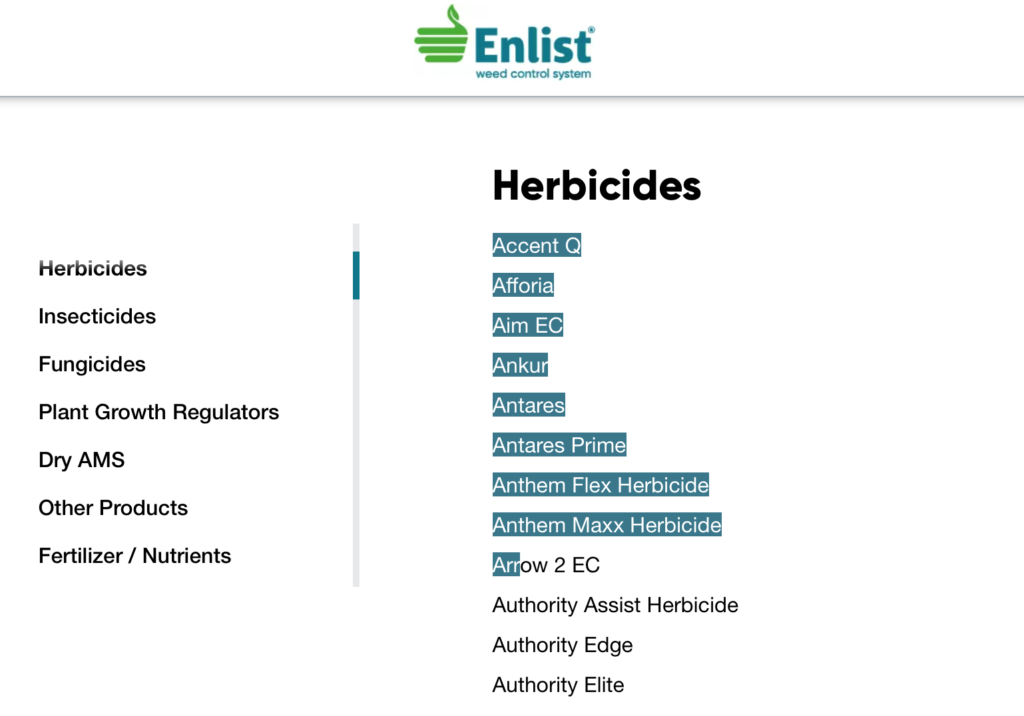
We recently discovered that the Enlist tank mix we intended to post spray on our beans was not label approved after running into some gumming issues. Of course what does “label approved” even mean for Enlist where the label doesn’t include any tank mix products and those are instead offloaded to a list on the website where a person could let’s say accidentally be looking at the Enlist One tank mix list back in March and miss the fine print at the top showing that he was on the Enlist One and not the Enlist Duo webpage.
But I digress.
I wanted to definitively comb through all of the chemicals on the Enlist Duo tank mix page and find any other chemicals that contained metolachlor to replace our generic Dual.
A person who knew their chemicals well could probably look down this list and come to a faster conclusion, but for me, using a technical solution was the next best thing.
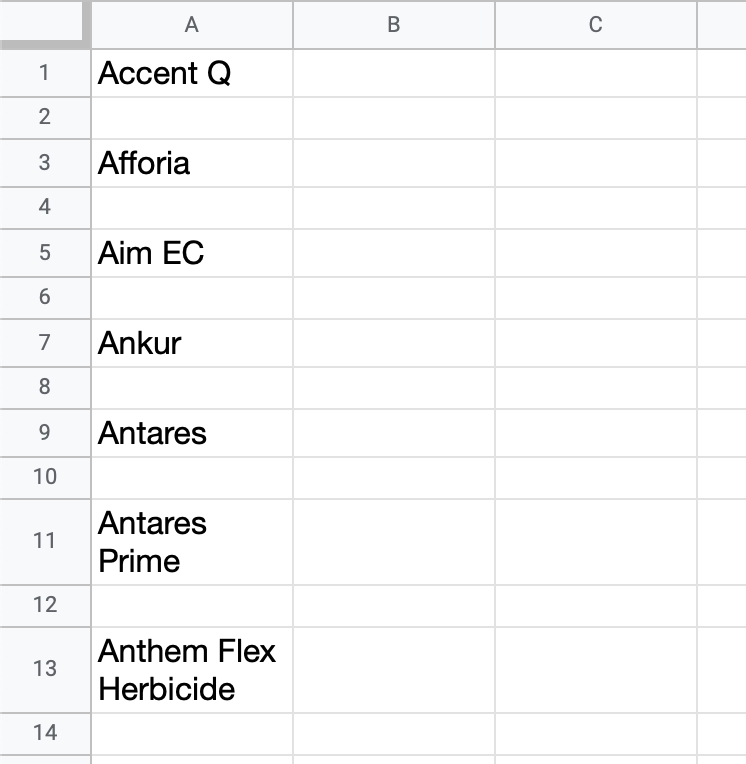
1. Paste chemical list into Google Sheets
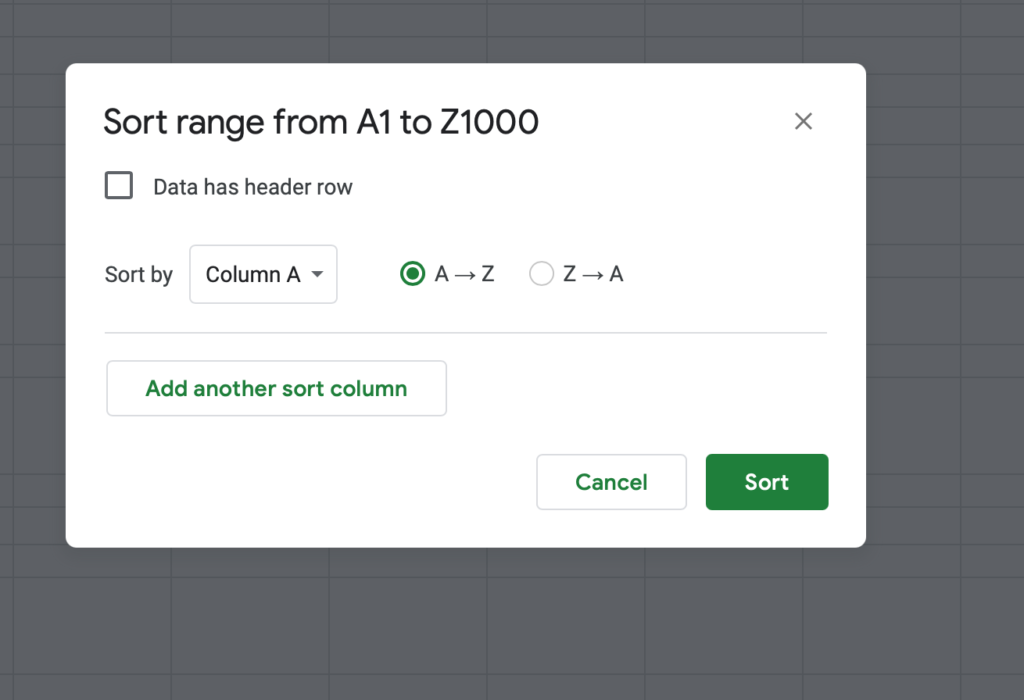
The list formatting of the Enlist webpage caused a blank row to be inserted between every chemical, so a simple alphabetical sort will fix this problem.
2. Create label Google search URL via cell formula
When you visit google.com, enter a search query in the box and go, you’re directed to a page that encodes the search term in the URL. This is simple, well known, and has been Google’s URL format for as long as I can remember.
https://www.google.com/search?q=YOUR+SEARCH+TERM
This makes it possible to share the link to a Google search page and also allowed sites like Let Me Google That for You to land users on a working Google page.
Spaces in a Google query are replaced with a + when encoded in the URL, so we need to run the SUBSTITUTE() function on the chemical names. It’s also helpful to first wrap the chemical name in TRIM() to trim off any spaces at the beginning or end of the name.
=SUBSTITUTE(TRIM(A1)," ","+")
This will turn Moccasin II Plus into Moccasin+II+Plus
We can append this function to the base Google URL which never changes using the & operator.
Getting close! A few things to append to the search to increase the likelihood of having a label on the first result.
Add the words herbicide and label to the end of the search term.
I actually didn’t have the word herbicide in mine and realized later I should have added this. There was a big difference between the shipping-themed results for “express label” vs “express herbicide label”
Filter to PDF document types, using the type:pdf parameter
Note: the colon in the PDF parameter must be encoded to %3A for the URL.
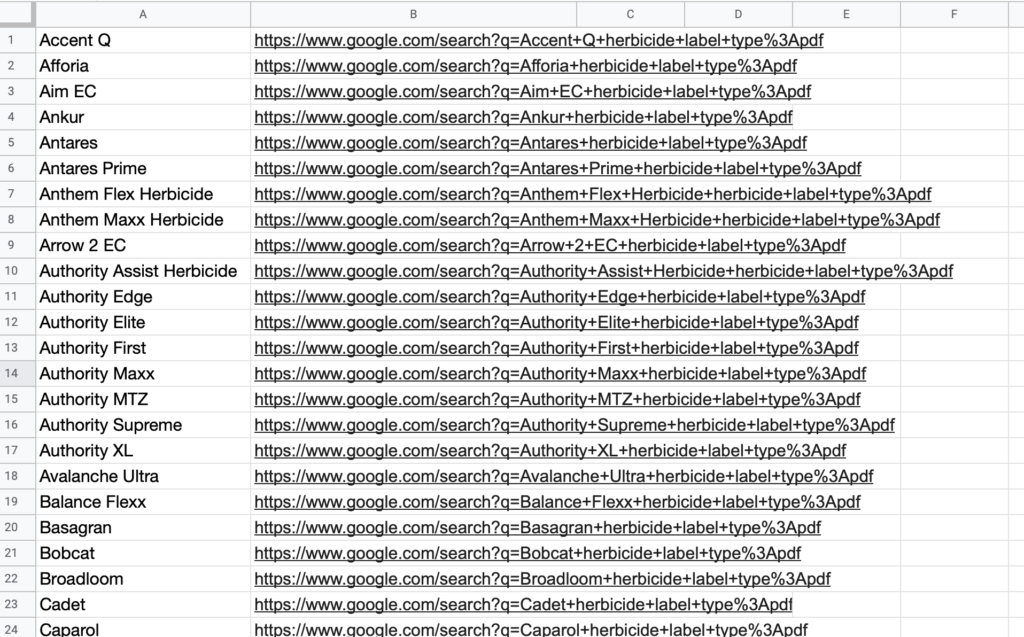
Append those extra parameters to the end, and you have the final formula
You should now have a column full of valid Google search pages.
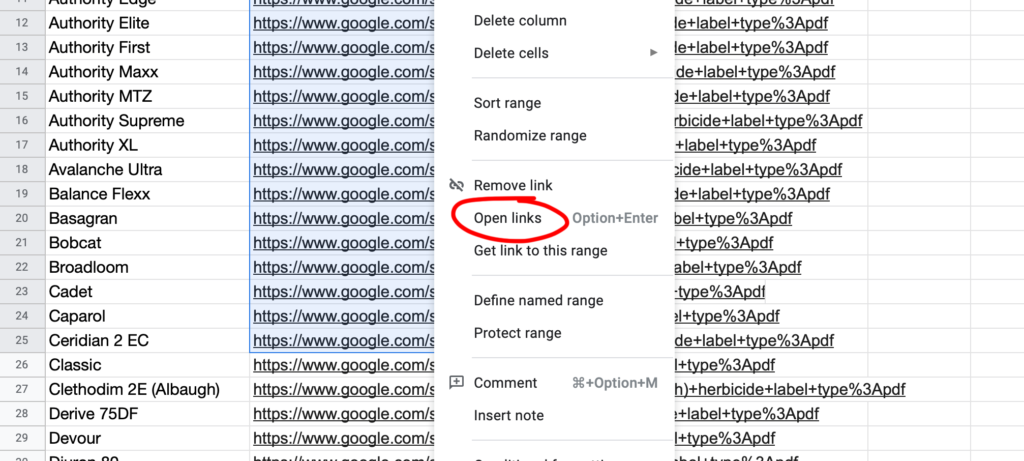
Drag to select a handful of these links (maximum of 50), right click, select Open Links, and hold onto your butts.
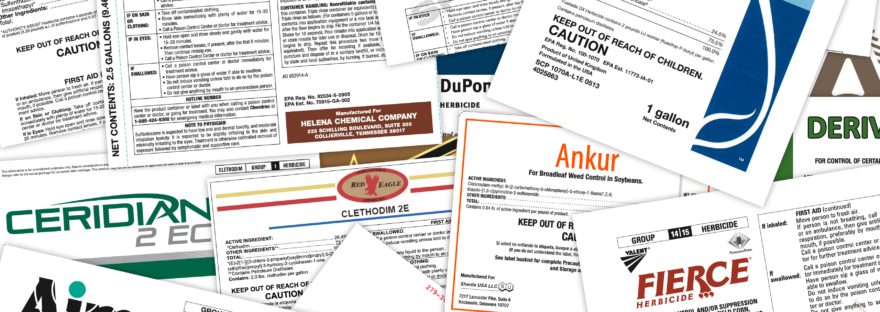
Here’s a few pixels showing this in action.
You should now have a browser tab with a search results page for each chemical selected. In most cases, the label will be the top result since we’re only looking for PDFs.
I also added an extra column to my spreadsheet with a checkbox validation type so I could check off after I reviewed each label. It helped a lot that they were in alphabetical order and that the tabs opened in the same order as the list.
Bottom Line
I created this spreadsheet at 6:42 PM and I viewed the last of 99 labels at 7:14 PM. That 32 minutes includes all the setup and formula creation, along with jotting notes on some active ingredients. If you were on a decent internet connection and wanted to glance through active ingredients on a big list of labels, I think you could easily push 8-10 labels a minute.
This also may not be the exact thing you need to do, but knowing how to automate the opening of Google search pages can come in handy for all kinds of research.
⚠️This guide is out of date after the 2022 changes to WAAS satellites 135 and 138. Click here for an updated guide.
The Trimble EZ Guide Plus was our farm’s first entrance to precision guidance in the mid-2000s. While we’ve since moved several tractors to a GreenStar autosteer system, the lightbars have stuck around for spraying and some odd tillage for their simplicity and affordability.
The last few years, keeping these running has felt like a stubborn insubordination to obsolescence as dealers and neighbors tease us for using such old guidance; but here we are, adjusting satellites and finding some runway to squeeze a bit more life out of what we have.
Assumptions
The scope of this guide is pretty narrow: we had one lightbar with working corrections, one without. I changed all the corrections to match the working one and that fixed the issue. So this is a recipe that I superstitiously follow without fully understanding the theory of specific satellites. For example, you probably don’t need to worry about MSAS (looks to be a Japanese corrections network) but who I am to question success?
Our equipment:
EZ Guide Plus
v4.11
I’m told this is the last version made for these
Hurricane L1 Antenna
Instructions
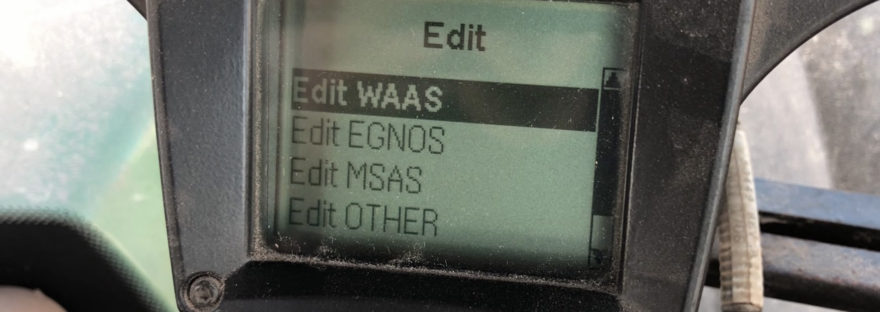
Navigate to Config menu > GPS > Corrections > Edit
You can get to the Config menu by scrolling all the way down on the icons along the right side of the run screen. It’s a wrench icon.
You should see Edit WAAS, Edit EGNOS, etc. You’ll need to enter each of these pages and set them to the following values.
In each of these pages, scrolling up or down will change the value in the dropdown, pressing OK will advance you down the list.
Edit WAAS
PRN-122: Off
POR: Off
PRN-135: Off
PRN-138: On
Edit EGNOS
AOR-E: Heed Hlth
IOR: Off
IOR-W: Heed Hlth
ARTEMIS: Off
Edit MSAS
MTSAT-1: Ignore Hlth
MTSAT-2: Ignore Hlth
Edit Other
(everything should be off)
Back up and out of the menu, and see what happens. ¯\_(ツ)_/¯
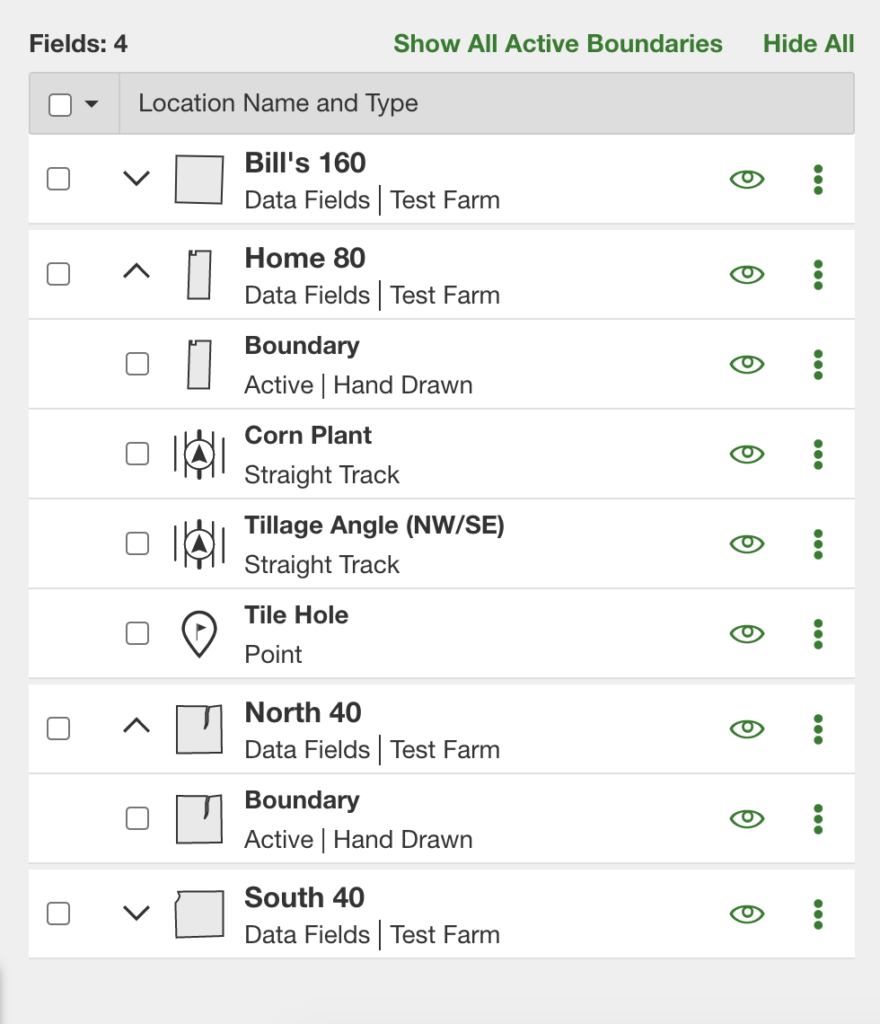
I spend at least a few hours a year in the John Deere Land Manager cleaning up flags, adjusting tracks, etc. After a period of time within the app, I want to stab my eyeballs out because it can be a real challenge to keep track of which fields are expanded and which elements are within in each field.
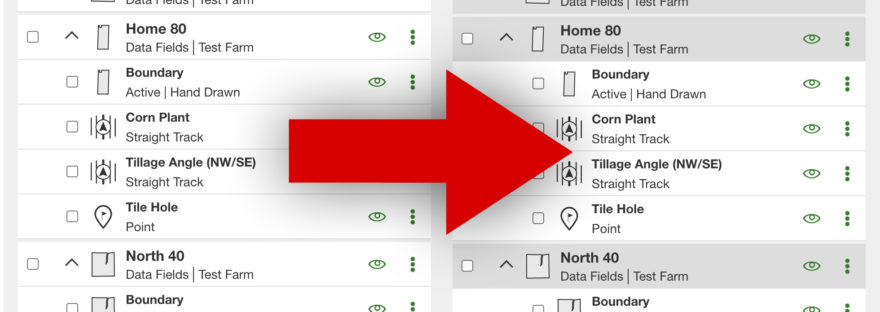
Visually, this looks a lot like a flat list and it’s not immediately obvious that Boundary, Corn Plant, Tillage Angle, and Tile Hole are child elements under Home 80. I dare you to work between these for a hour and see if you maintain your full sanity.
Fortunately, this is a web application, so we can easily adjust the styling within the browser using a Chrome browser extension like StyleBot.
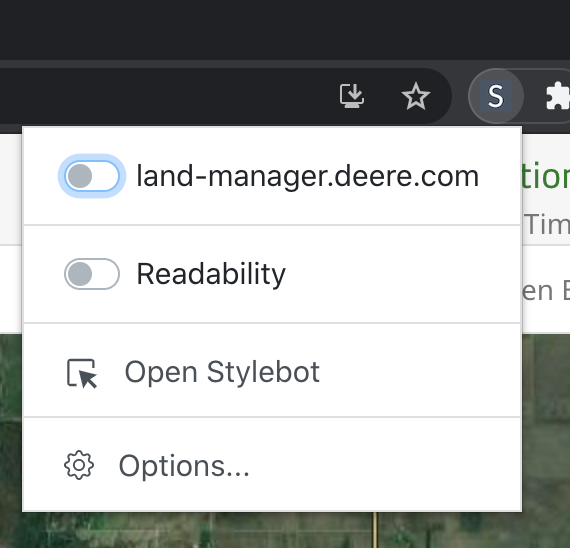
Download and install StyleBot in the Chrome Web Store, then log into the John Deere Land Manager. Click on the StyleBot extension in the extension tray (top right corner with the puzzle piece icon), and click Open StyleBot.
Then at the bottom of the pane, select Code and paste the following code in.
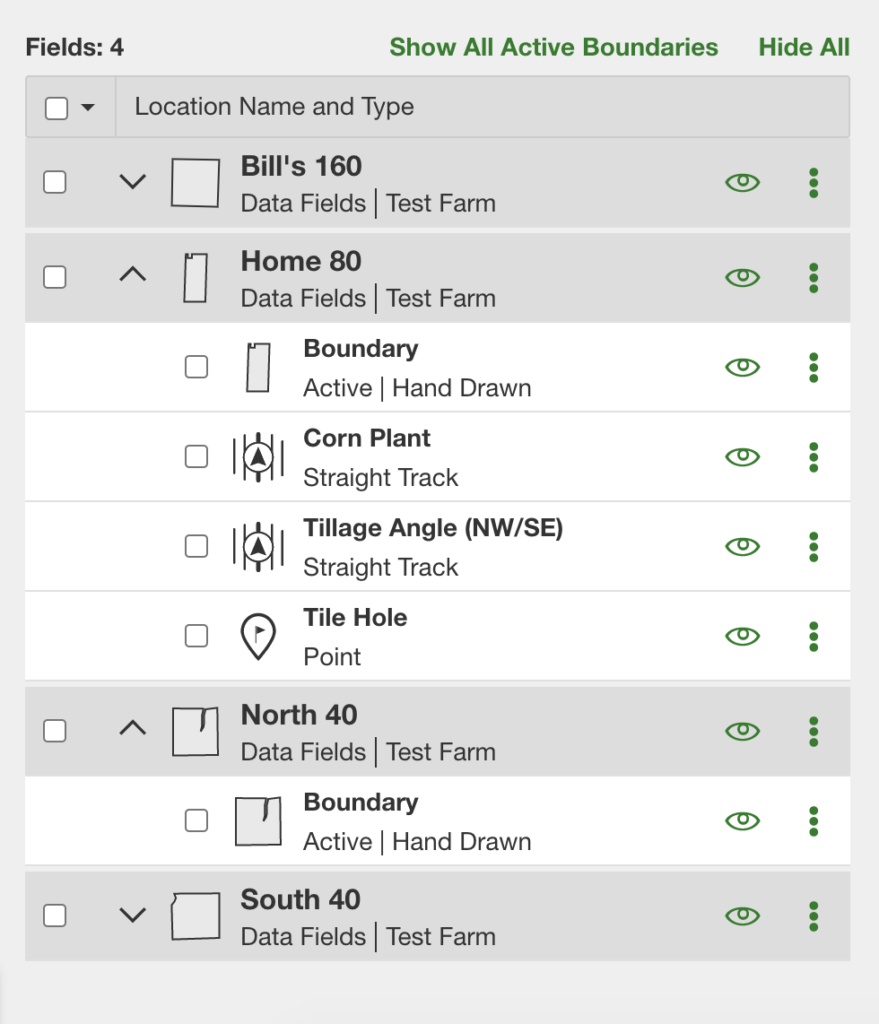
This will now automatically apply these two changes anytime you visit Land Manager in Chrome. The first style sets the background color of the parent elements to a darker grey to make it obvious which elements are top level field names and which ones are children. The second style adds padding to the left side of the child elements to indent them, making the hierarchy even more obvious.
Notice how obvious it is which fields are expanded, and what elements in this view are children to other elements.
I sent these screenshots to John Deere and suggested this style change- for the same reason it’s easy to change via StyleBot, it would be easy (from a technical standpoint) for them to make this change in the future. So it’s possible this could be changed in a future update. In the meantime, we can save a lot of headaches with this simple workaround.